My system comes up with the following NCAA Tournament bracket projections, based on all of the season's results. I will explain how the system works as I go along:
#1 Seeds

This table is for the Top 7 teams in the RPI rankings because historically all #1 seeds have come from the Top 7 in the rankings. My system evaluates teams using 118 factors, each of which relates to the factors the NCAA requires the Committee to use in evaluating teams for at large selections (most of the 118 are combinations of two individual factors). Most of the 118 factors have a "yes" value and a "no" value. If a team's profile meets a yes value, it means teams that meet that value always have received a positive decision from the Committee, in this case a #1 seed. If a team's profile meets a no value, it means teams that meet that value never have received a positive decision, thus in this case no #1 seed. If a team meets both yes and no values, it means the team has a profile the Committee has not seen before.
As you can see in the table, Florida State and UCLA meet at least 1 yes value and 0 no values. Thus the system identifies them as #1 seeds. (The team ranked #1 by the RPI always has gotten a #1 seed.) BYU has a profile the Committee has not seen before.
The table leaves BYU and the teams other than Florida State and UCLA to choose from for the remaining two #1 seeds. Texas Tech and Penn State have too many no values. This leaves BYU, Stanford, and Clemson as the candidates for the two remaining #1 slots.

Based on past history, after identifying clear #1 seeds, the factor that is most consistent with the Committee's picks for the remaining #1 seeds is their Head to Head v Top 60 Rank. This is based on a scoring system I developed that measures results against Top 60 opponents -- without regard for the ranks of those opponents. Using this as the tiebreaker, my system assigns the remaining #1 seeds to BYU and Stanford.
#2 Seeds

Using the same approach as for #1 seeds, the candidate group for #2 seeds is teams ranked #14 or better. Here, Arkansas is a clear #2 seed. After that, Penn State, North Carolina, Memphis, and Clemson all have profiles the Committee has not seen before. In addition, Texas Tech and Georgetown are potential #2 seeds.

The tiebreaker factor for #2 seeds combines a team's RPI rank with its Top 50 Results rank, each weighted at 50%. The Top 50 Results rank is based on a scoring system I developed, which is heavily weighted towards good results (wins or ties) against very highly ranked teams. It essentially asks, at how high of a level have you shown you are able to compete. It does not take losses into consideration.
As you can see, the tiebreaker assigns the remaining #2 seeds to Texas Tech, North Carolina, and Clemson.
#3 Seeds

The candidate group for #3 seeds is teams ranked #23 or better. Brown is a clear #3 seed. Penn State and Memphis are candidates with profiles the Committee has not seen before. Georgetown, Notre Dame, Georgia, and Pittsburgh also are in the running.

The tiebreaker for #3 seeds is a combination of a team's RPI rating and its Top 60 Head to Head score rank. The tiebreaker assigns the remaining #3 seeds to Penn State, Memphis, and Georgetown.
#4 Seeds

The candidate group for #4 seeds is teams ranked #26 or better. Harvard and Georgia are clear #4 seeds. Notre Dame, Pittsburgh, and Wisconsin also are in the running.

Here, the tiebreaker is a combination of a team's Top 50 Results rank and its conference's RPI. The tiebreaker assigns the remaining #4 seeds to Wisconsin and Notre Dame.
#5 through #8 Seeds
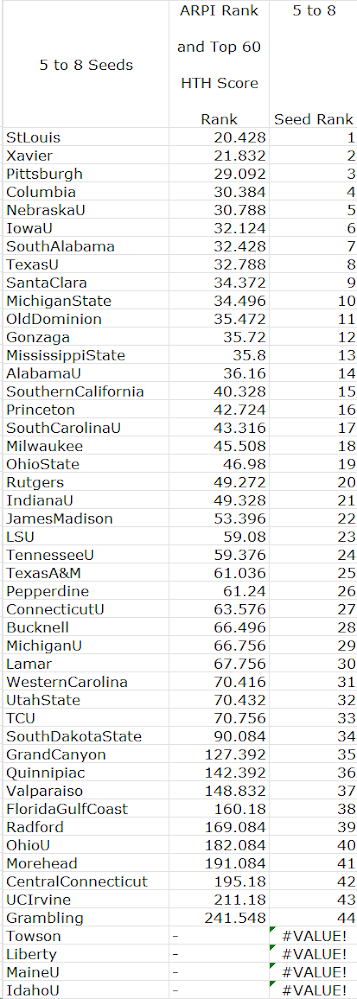
We did not have #5 through #8 seeds until last year. Because of that, we do not have an historic Committee pattern for those seeds. That being the case, I simply have used the combination of a team's RPI rank and its Top 50 Results rank as the basis for those seeds. This yields St. Louis, Xavier, Pittsburgh, and Columbia as #5 seeds; Nebraska, Iowa, South Alabama, and Texas as #6 seeds; Santa Clara, Michigan State, Old Dominion, and Gonzaga as #7 seeds; and Mississippi State, Alabama, Southern California, and Princeton as #8 seeds.
At Large

The candidate group for at large positions is teams ranked #57 or better. With the seeds and unseeded Automatic Qualifiers already set, there are 12 remaining at large positions. The above table says that South Carolina, TCU, Ohio State, and Indiana are clear at large teams, which leaves 8 positions to fill. Tennessee, Michigan, and LSU are possibilities with profiles the Committee has not seen before. Rutgers, James Madison, Pepperdine, UCF, Arizona State, Connecticut, and Texas A&M also are possibilities.

The at large tiebreaker is the combination of RPI rank and Top 60 Head to Head results rank. This is a change from prior years when RPI rank and Top 50 Results score rank was the best predictor of at large selections. Although I prefer the latter as a tiebreaker, the current statistical best predictor is the former, so that is what the above table shows. Based on this, Rutgers, James Madison, LSU, Tennessee, Texas A&M, Pepperdine, Connecticut, and Arizona State are the system's last 8 at large selections.
Overall
Based on the above, the following table shows the system's seeds, the unseeded Automatic Qualifiers (5 in the NCAA Seed or Selection column), the unseeded at large selections (6 in the NCAA Seed or Selection column), and teams from the Top 57 at large candidate group not getting at large selections (7 in the NCAA Seed or Selection column).

Interesting analysis. James Madison sticks out with a high Massey rating and a 3rd Sun Belt bid. How would SMU could compare for what seems to be one of the last bids?
ReplyDeleteAccording to my system, SMU had one "no," which was the combination of its Top 50 Results Rank (#90) and its Poor Results Score (-13). James Madison had no "no" results. That means they were very close. For James Madison, its Top 50 Results Rank was 31, and its Poor Results Score was -18, the combination of which did not give it a "no." The "yes" and "no" scores are not based on what I think is right or wrong, but rather on what matches the Committee decisions since 2007.
DeleteThus the selection of James Madison fits past Committee decisions, which appear to valued good results (wins or ties) against highly ranked teams, skewed quite heavily towards very highly ranked teams. In James Madison's case, this probably means that its tie @ #9 Georgetown persuaded the Committee,.
Rather than taking an approach based on a mathematical system, I decided to analyze the committee's decisions after the bracket was released in order to "reconstruct" the entire selection process. I determined that the committee considered 38 at large candidates for 33 at large spots. 31 candidates were selected during 1st pass, with Tennessee & Pepperdine (both with ZERO RPI Top 50 wins) getting in during the 2nd pass (because they had ZERO draws or losses vs RPI 101+). Last 4 in: Tennessee, Pepperdine, LSU & Colorado. First 4 out: South Alabama, SMU, UCF and UConn (TCU was also considered.) You are welcome to study my "reconstruction":
ReplyDeletehttps://docs.google.com/spreadsheets/d/10uWZR_DhOs0DSi8lg0NfGCls1OdGIaLOE6iVqheIMes/edit#gid=910852636
W88 - great analysis and writeup
DeleteVery nice work. Your looks at good and poor results relates to some of what I understand "goes on in the room" when the Committee is doing its work. It would be interesting if, at the end of the next season but before the NCAA announces the bracket, you were to apply your approach to project the bracket. Then, you could match it with the Committee decisions, to see how you have done.
DeleteBut again, very nice work.