Monday, August 28, 2023

2023 REPORT 6: UPDATE INCORPORATING RESULTS THROUGH AUGUST 27

 This is my second weekly report for the 2023 season.  Each week I show:

1.  Teams’ simulated ranks using the current NCAA RPI and my Balanced RPI;

2.  Based on the current NCAA RPI, teams in candidate pools (expanded) for NCAA Tournament #1, 2, 3, and 4 seeds and for at large selections and where they appear to fit within the pools; and

3.  Likely differences in at large selections for the NCAA Tournament if the Women’s Soccer Committee were to use the Balanced RPI rather than the current NCAA RPI.

The background for the information is in 2023 Reports 1 through 4.

Each week, I replace my simulated results for the previous week with actual results.  So this week’s information is based on actual results of games played through Sunday, August 27, and simulated results of games not yet played.

Summarizing the likely differences in at large selections for the NCAA Tournament in changing from the current NCAA RPI to the Balanced RPI, derived from the last table below:

At Large Candidate Teams:  10 teams that are not at large candidates under the current NCAA RPI are candidates under the Balanced RPI.  Of these, 4 are from the West, 4 from the South, and 2 from the Middle regions.  8 are from Power 5 conferences and 2 are from mid-majors.

No Longer Candidate Teams:  10 teams that are candidates under the current NCAA RPI are not candidates under the Balanced RPI.  Of these, 5 are from the North, 4 are from the South, and 1 is from the Middle.  All 10 are from mid-major conferences.  Of these, all either are Automatic Qualifiers or likely would not get at large selections under the current NCAA RPI.

Selected Teams: 4 team that likely are not at large selections under the current NCAA RPI likely are at large selections under the Balanced RPI.  Of these, 2 are from the West and 2 from the South.  All 4 are from Power 5 conferences.

No Longer Selected Teams: 4 teams that likely are at large selections under the current NCAA RPI likely are not at large selections under the Balanced RPI.  Of these, 2 are from the North and 2 from the South.  All 4 are from mid-majors.

The basic change pattern is that teams dropped from the at large candidate pool either are Automatic Qualifiers or likely are not at large selections under the current RPI, so they are not hurt by a change to the Balanced RPI.  But of the teams added to the candidate pool under the Balanced RPI, some likely are at large selections, displacing teams that are at large selections under the current NCAA RPI.  Thus the effect of the defects in the current NCAA RPI is to prevent teams that deserve at large selections from even being considered by the Committee, with the result that less deserving teams are getting at large selections. 

Simulated Ranks

(ARPI 2015 BPs is the current NCAA RPI; URPI 50 50 SoS Iteration 15 is the Balanced RPI)

NCAA Tournament Seed and At Large Selection Candidate Pools (based on current NCAA RPI)

At Large (showing Top 80 teams)


#1 Seeds (showing Top 11 teams)


#2 Seeds (showing top 20 teams)


#3 Seeds (showing Top 30 teams)


#4 Seeds (showing Top 40 teams)


NCAA Tournament At Large Selections Using Current NCAA RPI As Compared To Balanced RPI


Monday, August 21, 2023

2023 REPORT 5: UPDATE INCORPORATING ACTUAL RESULTS THROUGH AUGUST 20

 This is my first weekly report for the 2023 season.  Each week I will show:

1.  Teams’ simulated ranks using the current NCAA RPI and my Balanced RPI;

2.  Based on the current NCAA RPI, teams in candidate pools (expanded) for NCAA Tournament #1, 2, 3, and 4 seeds and for at large selections and where they appear to fit within the pools; and

3.  Likely differences in at large selections for the NCAA Tournament if the Women’s Soccer Committee were to use the Balanced RPI rather than the current NCAA RPI.

The background for the information is in 2023 Reports 1 through 4.

Each week, I replace my simulated results for the previous week with actual results.  So this week’s information is based on actual results of games played through Sunday, August 20, and simulated results of games not yet played.

Simulated Ranks

(ARPI 2015 BPs is the current NCAA RPI; URPI 50 50 SoS Iteration 15 is the Balanced RPI)


NCAA Tournament Seed and At Large Selection Candidate Pools (based on current NCAA RPI)

At Large (showing Top 80 teams)


#1 Seeds (showing Top 10 teams)


#2 Seeds (showing top 20 teams)


#3 Seeds (showing Top 30 teams)


#4 Seeds (showing Top 40 teams)


NCAA Tournament At Large Selections Using Current NCAA RPI As Compared To Balanced RPI

See some discussion following the table:


In the table, the specific teams are not particularly important this early in the season.  The general nature of their conferences and regions, however, paint a pretty good picture of the difference between the current NCAA RPI and the Balanced RPI.  Of particular import, as demonstrated elsewhere, the current NCAA RPI discriminates against stronger conferences and regions whereas the Balanced RPI does not.  The effects of this show up in the table:

1.  The red highlighting is for teams that are in the Top 57 using the current NCAA RPI and thus candidates for at large positions in the NCAA Tournament, if not Automatic Qualifiers.  But under the Balanced RPI they are outside the Top 57 and therefore not candidates for at large positions.  Note that none of these eight teams is from a Power 5 conference.  (Although the current NCAA RPI, for the simulated season, has the Ivy as the #5 conference, the Balanced RPI has it as #8.  The current NCAA RPI has the Big East as #7, with the Balanced RPI having it at #7.)

2.  The eight teams that replace the eight red highlighted teams are Washington, Arizona State, Colorado, Auburn, Mississippi, Cal State Fullerton, Oregon, and Arizona (the latter two of which are disqualified from at large selection due to records below 0.500).  Note that all of these are from Power 5 conferences except for Cal State Fullerton which is from the strongest region based on average ratings, the West.  Also, Cal State Fullerton is from the BigWest conference, which the current NCAA RPI ranks #19 but the Balanced RPI ranks #10.  (Note that the current NCAA Non-Conference RPI ranks it at #13.  The NCAA says that the Non-Conference RPI is a better measure of conference strength than is the current NCAA RPI, and my own analysis confirms this.)

3. Of the teams in the Top 57 under both rating systems, there are four that likely would get at large selections under the current NCAA RPI but not under the Balanced RPI: Oklahoma State, Brown, Butler, and Monmouth.  Only one of these is from a Power 5 conference.

4.  Likely replacing those four teams are four that are outside the Top 57 under the current NCAA RPI: Washington, Colorado, Arizona State, and Auburn.  All are from Power 5 conferences and three from the strongest region.

5.  Thus the red highlighted teams eliminated from contention under the Balanced RPI are not hurt in terms of NCAA Tournament at large selection because they either are Automatic Qualifiers or likely would not get an at large position under the current NCAA RPI.  However, under the Balanced RPI they are replaced by teams that should be in contention but are not under the current NCAA RPI because of its discriminatory effects.  Further, some of the replacement teams likely would get at large selections -- in the current simulation, four replacement teams likly would get them -- thus displacing from at large selection other less deserving teams based on Committee historic patterns. 

Wednesday, August 16, 2023

2023 REPORT 4: CURRENT NCAA RPI versus BALANCED RPI IN RELATION TO NCAA TOURNAMENT AT LARGE SELECTIONS

Historically, the poorest ranked team to get an NCAA Tournament at large selection is #57 using the current NCAA RPI.  Thus I consider the candidate pool of teams for at large selections to be those ranked #57 or better.

To illustrate the difference between how the current NCAA RPI ranks teams in relation to the Tournament and how the Balanced RPI ranks them, I prepared the following table showing my simulated end-of-season Top 57 under the current NCAA RPI and under the balanced RPI.  Given that the table is based on a pre-season simulation that has the limitations described in 2023 Reports 1 and 2, I do not see the exact teams inside and outside the Top 57 under the two systems as something to focus on.  On the other hand, the general nature of the teams inside and outside the Top 57 is significant. And, it is consistent with what I expected given that the current NCAA RPI discriminates against teams from stronger conferences and regions and the Balanced RPI does not.  (See RPI: Modified RPI? at the RPI for Division I Women’s Soccer website.)

As a note based on past history, for the teams in the Top 57 under the current NCAA RPI but not under the Balanced RPI (yellow highlighting in table), some of them are likely to be Automatic Qualifiers and most of the others likely would not get NCAA Tournament at large selections.  Thus their dropping out of the Top 57 under the Balanced RPI, by itself, probably would not affect Tournament at large selection outcomes.  However, those teams are occupying spaces within the Top 57 candidate group that instead would be occupied by teams that are in the Top 57 under the Balanced RPI but not under the current NCAA RPI (blue highlighting).  Based on past history, some of those teams likely would get at large selections.  Thus those are the teams that are potentially hurt by the defects in the current NCAA RPI.

In the table, the URPI 50 50 SoS Iteration 15 Rank is the Balanced RPI Rank.


The table does not show, however, the likelihood that the blue highlighted teams in fact would get at large selections.  To explore that likelihood, I turn to the factor I use that is the best predictor of teams the Committee will give at large selections.  That is the paired factor RPI Rank and Top 50 Results Rank.  This paired factor, if used as the only basis for making at large selections, matches past Committee selections at a rate, on average, of all but two selections per year.  Thus it is a very good predictor of Committee at large decisions.

The following table uses this paired factor to show which teams likely would be treated the same and which likely would be treated differently under the Balanced RPI as compared to the current NCAA RPI.  As with the previous table, I do not see the exact teams affected by the change as something to focus on.  On the other hand, the general nature of the teams affected is significant.


Sunday, August 13, 2023

2023 REPORT 1: PRE-SEASON STRENGTH RANKINGS

 [Coming next: Simulated 2023 End-of-Season Ranks]

********

This is the first of three pre-season reports I will post.  As we move through the season, I will do weekly reports similar to the second and third of the pre-season reports.  This week, each report will have a detailed explanation of how I arrived at the information in the report.  For later weeks, I will not repeat the explanations, so if you have questions about the future reports, please first refer back to this week’s explanations.  If you still have questions, ask them in a comment and I will answer.

********

After each season, I produce pre-season team strength rankings for the next season.  At the end of this post, I show my pre-season strength rankings for the 2023 season.  I produce them using a process that I set up intentionally to eliminate subjective decisions on my part.  This makes the process transparent: Anyone can know what the process is and decide how much, if anything, it is worth.  Here are the steps I go through:

1.  I have a data base of all teams’ end-of-season ranks since 2007.  For years beginning with 2010, the ranks are what they would have been if the current no-overtime rule had been in effect.  There are three sets of ranks:

a.  Using the current NCAA RPI formula;

b.  Using the Kenneth Massey rating system, since he is a respected producer of sports ratings and produces ratings and ranks for Division I women’s soccer; and

c.  Using my Balanced RPI, which is an RPI modification that produces more accurate and non-discriminatory ratings and ranks than the current NCAA RPI.

I use the Massey ranks simply as a basis for testing the credibility of the current NCAA RPI and my Balanced RPI.  The current NCAA RPI produces ranks that are significantly different than Massey’s.  My Balanced RPI produces ranks that are quite similar to Massey’s, athough using an entirely different calculation method.

2.  Predicting teams’ strength for the coming year is difficult, as teams’ strength varies a lot from one year to the next except near the very top and bottom of the rankings.  The average rank standard deviation for teams is 50 rank positions.  What this means is that roughly two-thirds of the time, you can expect the team’s rank to be within 50 rank positions of its average rank -- in other words, to fall within a 100 position range that has its average rank in the middle.  Thus while predicting teams’ strength next year may be worthwhile and useful for some purposes, it is speculative, especially in the middle of the rankings.

There are various ways to predict strength for the coming year, and I have chosen one of them: using averages and/or trends based on historic ranks.  This has limitations as a method, but does reasonably well when predicting the relative strength of teams within a conference, as compared to other methods for ranking them:  In 2022, conference coach pre-season rankings of teams within their conference on average were within 2.44 positions of the teams’ actual end-of-season ranks.  Chris Henderson’s ranks matched the coaches’ 2.44.  His rankings are based on returning starters, talent depth, goalkeeper rankings, transfer rankings, his CoachRank metric, and recruiting rankings, with penalties for losing 6 or more starters from the prior year or for extremely poor in-conference results in the prior year.  My ranks, when applied to conferences, were within 2.61, in other words were almost as good as theirs notwithstanding that my method is based only on historic ranks.

3.  Within my system, I have a list of alternative methods I choose from to generate a team’s strength rank for next year.  The methods are:

a. Use the team’s rank from last year

b. Use the team’s average rank over the last two years, three years, four years, five years, six years, seven years, eight years, or nine years.

c. Use the team’s rank trend over time to create a formula that produces a rank for next year, using trends over the last two years, three years, four years, five years, six years, seven years, eight years, or nine years.

 d. Pair each method from a and b with each method from c, using the average of the two, such as the average of the rank from last year and next year’s trended rank based on the last two years’ ranks, the average rank from the last two years and next year’s trended rank based on the last two years’ ranks, and so on.

4.  For each team, for each of the methods in step 3, I calculate how close the method would have come to predicting the team’s rank for each future year if I had used the method year-after-year in the past.  I then select the method that would have come closest, on average, to predicting the team’s next year ranks.  This is the method I use for that particular team.

As a matter of interest, the method that most commonly is the best predictor of the coming year’s rank is last year’s rank, occurring for 58 teams for the 2023 strength rankings.  Using that or using only average ranks over some period of years accounts for 138 teams.  Using only trends accounts for 25 teams.  Using average rank over some period of years combined with trend over some period of years accounts for the remaining teams, about half of them.

This method does produce occasional odd results of seriously overranking or underranking a team:

Quinnipiac.  A good example this year is Quinnipiac.  As it turns out, the best method for predicting its rank is to base the prediction on its two year trend.  Quinnipiac’s rank has trended much better over the last two years, due to the fact that it had recruited an excellent Irish striker.  Using its rank trend over the last two years, my method says it will be ranked tied for #14 this coming season.  The striker, however, has transferred to Penn State.  Quinnipiac almost certainly would not have been #14 even with her (see Arkansas, below) and almost certainly is not going to be #14 this coming season without her.  Nevertheless, I stick to the method I have described and simply know that Quinnipiac likely is a case of serious overranking.

Arkansas.   For Arkansas, the best method for predicting its upcoming rank is to use its eight year trend.  For the coming year, this puts it predicted as #1.  The problem with this is that it has been in or near the Top 10 for the last three years.  In that area, it becomes increasingly difficult to improve rank positions, so that a team such as Arkansas is not likely to improve as much as its long term trend suggests.  Here again, I stick to the method but know that Arkansas is not likely to end up where its trend suggests.

5. At this point in my process, I have a projected strength rank for next year for each team.  Generally, a team rank will not be a whole number but rather something like #144.34.  I put the teams in strength rank order from the best rank to the poorest and then, with the teams in that order, assign them whole number ranks in order from #1 to the poorest.

6. I then assign ratings to the teams.  To do this, I have calculated the historic average current NCAA RPI formula ratings for all of the rank levels from #1 to the poorest.  I assign #1 the historic average rating for the #1 ranked teams, #2 the historic average rating for the #2 ranked teams, and so on.  (I also have fill-in steps I use when new schools sponsor Division I teams.)

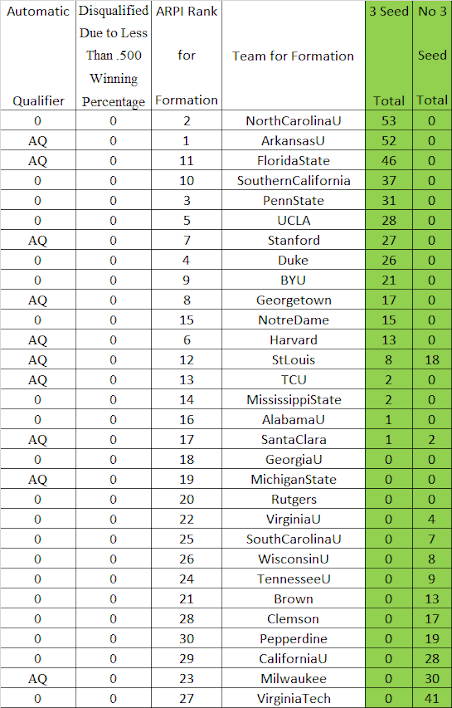
7.  After going through all of the above steps, I have assigned to each team a pre-season strength rating and rank.  Here are the ranks this process produces for 2023, first in Rank Order and then in Alphabetical Order:

Rank Order:


Alphabetical Order:


Friday, August 11, 2023

2023 REPORT 2: SIMULATED END OF SEASON RANKINGS

 [Coming Next: Pre-Season NCAA Tournament Seed and At Large Selection Candidates]

In the preceding post, I showed how I assign pre-season strength ratings and ranks to teams.  In this post, I show, if the assigned strength ratings and ranks are correct, an approximation of what teams’ end-of-season ranks will be given their schedules.

Here is the process I use to generate the end-of-season ranks:

1.  After downloading all the team schedules for the coming year, for each game, I calculate the pre-season strength rating difference between the teams.  I then adjust the rating difference to account for home field advantage.  (In neutral site games, there is no game location adjustment.)  In rating terms, based on games played since 2010, home field advantage on average is worth 0.0145.  So if the better rated team is the home team, I increase the rating difference between the teams by 0.0145 and if the better rated team is the away team I decrease the difference by 0.0145.

2.  Using the location-adjusted rating difference for a game, I then determine a predicted outcome for that game.  To do this, I use a table that shows, for each rating difference level (to four decimal places), the likelihood of the better rated team winning, tieing, or losing the game.  The table is based on the location-adjusted rating differences and results for all games played since 2010.

In predicting the outcomes, if the win likelihood of a team is 50% or greater, I predict a win for that team and a loss for its opponent.  If the win likelihood of the better rated team is less than 50%, then I predict a tie, even though one team is more likely to win than the other.  I do this because if the win likelihood of the better rated team is less than 50% and I predict a win by the better rated team, I am more likely than not to be wrong: The result is more likely to be a tie or a loss than a win.  Of course, predicting a tie also is more likely than not to be wrong, since the result is more likely to be a loss or a win.  I have chosen to predict a tie because although more likely than not to be wrong, it will be closer to the right result than if I had predicted a win and and the result was a loss.  One side effect of doing this is that the system predicts more ties than actually are likely to occur -- for the upcoming season it predicts 28% of games as ties whereas the historic actual number of ties is 21%.

There is another side effect, due to my assuming that a team with a 50% or more win likelinood will win the game:  It overstates their wins or their losses.  As an example, suppose a team has a 75% win probability in each of four games.  My system says they will win all 4 games.  From a statistical perspective, however, one would expect them to win 3 games and lose 1.  Unfortunately, at this point my system design does not recognize that.

3.  For conference tournaments, based on the in-conference predicted game results I determine conference standings and set the conference tournament brackets.  For conference tournament games that are ties, the team with the better location-adjusted rating is the winner.  This continues through each round of the conference tournament.

4.  With all of the game results for the season, I then calculate simulated team end-of-season ratings and ranks, for both the current NCAA RPI and my Balanced RPI.

5.  Since the simulated end-of-season ratings and ranks are based on every game result being consistent with teams’ assigned pre-season strength ratings and ranks, one might think that the end-of-season ranks should match the pre-season strength ranks.  They do not.  Here is why:

a.  This year, including conference tournaments, the average number of games per team will be 18.4. This is slightly fewer than the 18.7 average since 2013 (excluding Covid-affected 2020).

b.  For a mathematical rating system for sport teams to be truly reliable, the teams need to play about 25 to 30 games. In general, as the number of games increases the system is more reliable and as the number decreases it is less reliable. The NCAA RPI staff publicly recognized years ago that you have to have enough games for a rating system to be reliable:

"Sports like softball and baseball actually play the most games and it could be argued that they [their RPI ratings] are the most accurate because the sample is larger. Soccer falls somewhere in the middle of the RPI sports in terms of number of games. A football RPI would be very difficult to use since each game would have such an enormous impact on a team’s rating. In soccer, Division I teams play at least 20 games, and many play at least 25."
FCS football schools, which are what the NCAA was referring to, play about 13 and as many as 15 games. Contrary to the statement of the NCAA RPI staff, Division I soccer teams always have played in the vicinity of 17 to 18 games per year. Occasionally, with conference tournaments, a small number of teams get above 20. The statement that teams play "at least 20 games, and many play at least 25" is wrong.

Given this, any mathematical rating system for DI women’s soccer always is going to have reliability issues due to teams not playing enough games. Thus one should expect that the predicted end-of-season ranks will have differences from the assigned pre-season strength ranks.  Still, one way to compare different rating systems is to compare how well their predicted end-of-season ranks match the assigned pre-season strength ranks.

6.  After going through these steps, here are (a) teams’ assigned pre-season strength ranks and (b) their simulated end-of-season ranks using the current NCAA RPI and also using the Balanced RPI.  Across all teams, the average difference between the pre-season strength ranks and the current NCAA RPI ranks is 27 positions.  The average difference for the Balanced RPI is 11 positions.  Thus the Balanced RPI does a much better job of ranking teams consistently with their strength than the current NCAA RPI.

The first table puts the teams in Rank Order and the second in Alphabetical Order:

Rank Order:


Alphabetical Order:


2023 REPORT 3: PRE-SEASON NCAA TOURNAMENT SEED AND AT LARGE SELECTION CANDIDATES

 In the preceding post, I explained how I produce simulated end-of-season ratings and ranks.  In this post, I will explain how I use those ratings and ranks and other data from the simulated season in order to identify teams likely to be candidates for NCAA Tournament seeds and at large selections.

The NCAA annually, in its Pre-Championship Manual, identifies the factors the Women’s Soccer Committee is to consider when seeding and making at large selections for the NCAA Tournament.  Based on the Manual and studies of game results data as compared to the Committee’s decisions since 2007, I have identified 15 key factors for the decisions:

RPI rating

RPI rank

Non-conference RPI rating

Non-conference RPI rank

Value of good results (wins or ties) against Top 50 opponents

Rank of good results (wins or ties) against Top 50 opponents

Value of head-to-head results (wins, ties, or losses) against Top 60 opponents

Rank of head-to-head results (wins, ties, or losses) against Top 60 opponents

Value of common opponent results (wins, ties, or losses) compared to the results of other Top 60 teams that have played the same opponents

Rank of common opponent results (wins, ties, or losses) compared to the results of other Top 60 teams that have played the same opponents

Conference standing (average of regular season conference standing and finishing position in conference tournament)

Conference RPI

Conference RPI rank

Value of poor results

Poor results rank

In addition to these factors, I have created another group of paired factors: I pair each individual factor with each other factor, with each factor weighted at 50%, which results in 103 additional factors or a total of 118 factors both individual and paired.

For each of the individual factors that does not have an NCAA or conference-created scoring system, I have created my own scoring system.  You can find the details of my scoring systems in an NCAA Tournament Decisions resource I created for coaches.

By comparing the NCAA Tournament seed and at large selection decisions over the years to the factor scores, for each type of decision -- a particular seed level or an at large selection -- I have identified certain factor scores that (1) always have gotten teams "yes" decisions and (2) always have gotten teams "no" decisions.  For example, for #1 seeds, the team with the #1 RPI rank always has gotten a #1 seed (a yes decision) and teams with RPI ranks of #8 or poorer never have gotten #1 seeds (a no decision).  Most of the 118 factors have both yes and no standards for each type of decision.

At the end of the season, I match teams’ factor scores with the yes and no factor standards.  For each type of decision, this allows me to see how many yes and no factor standards a team meets.  If a team meets only yes standards for a particular decision, then the team should get a yes decision.  If it meets only no standards, then it should get a no decision.  If it meets no yes and no no standards, then it is a candidate for a yes decision but also might get a no decision.  If it meets both yes and no standards, then it has a profile the Committee has not seen before and likewise might get either decision.

Most often, at the end of the season, for a particular Committee decision some teams will meet some yes standards and no no standards.  If there are not enough teams only meeting yes standards to fill the decision quota (such as four #1 seeds), then ordinarily the remaining teams to fill the quota will come from teams that meet no yes and no no standards.  For the choice among those teams, based on comparing past Committee decisions to teams’ factor scores, I have identified which factor(s) matches best with the Committee choices.  Using at large selections as an example, if I first give at large selections to teams that meet one or more yes standards for at large selection and no no standards, my selections on average match the Committee selections historically for all but about 2 at large selections per year.  If I then consider teams that meet no yes and no no standards, using the factor that best matches the Committee choices from 0 yes - 0 no teams, I narrow the gap to matching the Committee decisions for all but 1 at large selection per year.  As a matter of interest, in this process, the factor that best matches the at large selections is the paired factor of RPI rank and Top 50 results rank.

Using my pre-season simulated end-of-season ratings and ranks and related data, given the excess number of ties and the treatment of all games with a win likelihood of 50% or more as wins, teams’ data are too exagerrated for me to use the process I just have described to do a reasonable pre-season simulated NCAA Tournament bracket.  I can, however, show how teams fare in the factor standards yes and no system.  So, for what it is worth, here is how teams fare for each of the NCAA Tournament decisions (excluding #5-8 seeds, initiated last year):

At Large Selections (showing Top 80 teams)


#1 Seeds (showing Top 10 teams)


#2 Seeds (showing Top 20 teams)


#3 Seeds (showing Top 30 teams)


#4 Seeds (showing Top 40 teams)