Monday, October 31, 2022

EVALUATION OF TEAMS FOR NCAA TOURNAMENT PURPOSES BASED ON ACTUAL RESULTS OF GAMES THROUGH OCTOBER 30 AND SIMULATED RESULTS OF FUTURE GAMES

Below are tables showing simulated seed and at large selection candidate groups based on the actual results of games played through October 30 and simulated results of games not yet played.

For the candidate groups for seeds and at large selections, each table shows how many historic patterns each team meets indicating that the team will or will not get a positive decision from the Committee.  In addition, I have indicated potential Committee decisions based on the patterns.  If there are positions open for which there are not clear seeds or at large selections, an additional table shows a potential basis for filling those positions.  Each set of tables simply reflects Committee decision patterns from 2007 to the present.

In addition to the four pods of #1 through #4 seeds, the Committee this year will create four pods of #5 through #8 seeds.  The Committee has not done this before, so there are no directly applicable decision patterns to apply to the data.  Since 2010, however, the Committee each year has had 16 first round games involving unseeded opponents.  In those games, it appears the Committee has awarded home field to the team it concluded had performed better over the course of the season.  Since this is as good as we will get until the Committee actually has seeded four new pods, I have used the Committee patterns for selecting home teams for those games as a basis for projecting teams to be in the #17 through #32 seed range that will fill the four new pods.  I will not go into detail here, but will say that for the new seed pods I have used a method similar to what I historically have used for projecting Committee seeds and at large selections.  In general, my caution is to take these projections with a very big grain of salt.

To be clear:  All of the seeds and at large selections shown below are based on the assumption that all teams, through the end of the season, will perform in accord with their current ARPI ratings as adjusted for game locations.  In addition, they are based on the assumption the Committee will follow its historic patterns, which may not happen.

Reminder:  From among the teams that are not automatic qualifiers, the Committee will pick 33 at large participants.

#1 Seeds (Candidate Pool #1 through #7)


In the table, UCLA and North Carolina are clear #1 seeds and Duke and Arkansas clearly are not.  This leaves Alabama, Florida State, and Notre Dame to fill the remaining #1 seed slots.  Although it is possible Florida State also is a clear #1 seed, I decided to include it in the "tiebreaker" evaluation for #1 seeds:


This says that Alabama gets a #1 seed.  On the other hand, Florida State and Notre Dame are tied.  I have assigned Notre Dame the last #1 seed, simply on the basis of its regular season head-to-head win over Florida State.

#2 Seeds (Candidate Pool #1 through #14)


In the table, Florida State and Duke are clear #2 seeds.  The candidates for the other two slots are Stanford, St Louis, Arkansas, and Virginia.  Here is the tiebreaker table for those teams:


Based on the table, Arkansas and Virginia get the open #2 seed slots.

#3 Seeds (Candidate Pool #1 through #23)


Based on the table, Stanford, Pittsburgh, and Michigan State are #3 seeds.  St Louis, Penn State, and South Carolina are candidates for the last #3 seed.


According to the table, St Louis gets the last #3 seed slot.

#4 Seeds (Candidate Pool #1 through #26)


Based on the table, Penn State is a clear #4 seed.  The candidates for the remaining three slots are South Carolina, TCU, Tennessee, Texas, and Georgetown.


According to the table, South Carolina, Texas, and Georgetown get the three open #4 seed slots.

#5 - #8 Seeds (Candidate Pool #1 through #51)

Using a method similar to what you see above, here are the new seed pods, designated 4.5 through 4.8:


These teams all would host first round games and would be placed in the bracket in accord with their seeds.

At Large Selections (Candidate Pool #1 through #57)


In the table, the seeds are marked #1 through #4.8.  The unseeded automatic qualifiers are #5.  Mississippi State and Georgia are clear at large selections.  This leaves 10 at large slots to fill.  Oklahoma State, Fairfield, and Dayton clearly are not at large selections.  The other teams, from Virginia Tech down, are candidates for the 10 open slots.


In the table, teams with tiebreaker ranks #1 through #10 get at large selections.  Teams 11 through 14 do not.  In the long table above this one, the teams getting the 10 at large selections are marked #6 and the candidates not getting at large selections are #7.

Automatic Qualifiers


CURRENT ACTUAL RPI RATINGS FOR GAMES THROUGH OCTOBER 30

Use the following link for access to an Excel workbook with actual RPI ratings and ranks and other data for teams based on games through October 30, 2022: RPI Report 10.30.22. On the left of the RPI Report sheet, there are five color coded columns.  These columns are based on the seasons from 2007 to the present (excluding the 2020 Covid-constrained season).  They show the rank ranges as of this stage of the season from which #1 through #4 seeds have come.  They also show the at large bubble range and that teams ranked #28 or better as of this stage of the season always have gotten at large selections.

I have included some new columns this week:

1.  In Column J I added team ranks as contributors to their opponents’ strengths of schedule.  This is right next to Column I, which is team RPI ranks.  I have put these columns next to each other to highlight a major problem with the RPI formula:  A team’s RPI rank can be very different than its strength of schedule contributor rank.

2.  In Column L I added team Balanced  RPI Ranks.  These are ranks from a variation of the RPI formula I developed.  The variation (1) effectively eliminates the discrepancy between team RPI ranks and their strength of schedule contributor ranks and (2) makes other revisions so that conferences’ teams, in non-conference games, and geographic regions’ teams, in out-of-region games, perform in accord with their ratings.  This latter change effectively eliminates the RPI’s discrimination against teams from stronger conferences and regions.

To give a sense of the seriousness of the problems that the Balanced RPI corrects, here are the pertinent columns from the linked workbook:


END OF SEASON ARPI RANKS USING ACTUAL RESULTS OF GAMES PLAYED THROUGH OCTOBER 30 AND SIMULATED RESULTS OF FUTURE GAMES

Below are simulated end-of-season Adjusted RPI ranks using the actual results of games played through Sunday, October 30 (including conference tournament games) and simulated results of games not yet played (also including conference tournament games).  The simulated results of games not yet played are based on the October 30 new ARPI ratings of the opposing teams as adjusted for home field advantage.


Tuesday, October 25, 2022

END OF SEASON ARPI RANKS USING ACTUAL RESULTS OF GAMES PLAYED THROUGH OCTOBER 23 AND SIMULATED RESULTS OF FUTURE GAMES

Below are simulated end-of-season Adjusted RPI ranks using the actual results of games played through Sunday, October 23 and simulated results of games not yet played.  The simulated results of games not yet played are based on the October 23 new ARPI ratings of the opposing teams as adjusted for home field advantage.

The simulated ratings include simulated conference tournaments.  Where teams are tied in the conference standings, the tiebreaker my system uses for conference tournament seeding is not always correct.  If the actual seedings are available, I use those seedings.  If they are not, then it is possible some of my seedings are not consistent with the conference tiebreaker.  Any inconsistencies should not make a big difference.


EVALUATION OF TEAMS FOR NCAA TOURNAMENT PURPOSES BASED ON ACTUAL RESULTS OF GAMES THROUGH OCTOBER 23 AND SIMULATED RESULTS OF FUTURE GAMES

Below are tables showing simulated seed and at large selection candidate groups based on the actual results of games played through October 23 and simulated results of games not yet played.

For the candidate groups for seeds and at large selections, each table shows how many historic patterns each team meets indicating that the team will or will not get a positive decision from the Committee.  In addition, I have indicated potential Committee decisions based on the patterns.  If there are positions open for which there are not clear seeds or at large selections, an additional table shows a potential basis for filling those positions.  Each set of tables simply reflects Committee decision patterns from 2007 to the present.

Since there are no historic data showing how the Committee seeds teams #17 through #32 (in four seed pods designated #5 through #8 seeds), I have decided not to try to guess how the Committee will do that.

To be clear:  All of the seeds and at large selections shown below are based on the assumption that all teams, through the end of the season, will perform in accord with their current ARPI ratings as adjusted for game locations.  Further, they are based on Committee historic patterns.  Based on what I am seeing so far, it appears this is an unusual year.  I do not know why, but perhaps it is due to the Covid aftermath or increased parity, or both.  It also may be due to the no overtime rule, although a study I have done suggests the change to no overtime should not make a big difference.  Whatever the reason, however, it is possible Committee historic patterns will not hold up this year.

Reminder:  From among the teams that are not automatic qualifiers, the Committee will pick 33 at large participants.

#1 Seeds (Candidate Pool #1 through #7)


As the table shows, four teams have met standards where teams meeting those standards always have gotten a #1 seed and at the same time have not met any standards for never having goten a #1 seed.  Complicating this, however, Alabama has met 6 Yes standards and 1 No standard.  Further, Florida State has met only 1 Yes standard.  Thus UCLA, Notre Dame, and North Carolina are clear #1 seeds, but after that it is not so clear.

For situations like this, for each seed position and for at large selections, I have identified the most powerful factor related to that decision -- the one that is the most consistent with past Committee decisions where it is not clear who should fill a slot.  Where there are a number of equally powerful factors, I simply have picked one of them.  For #1 seeds, the factor I use is Head to Head v Top 60 Rank (based on my own scoring system).  Here is a table showing how the 4 teams that are not clear #1 seeds come out using that factor:


According to this table, Alabama gets the fourth #1 seed.

#2 Seeds (Candidate Pool #1 through #14)


Florida State is a clear #2 seed.  After that, there are three teams have have met both Yes and No standards and two teams that have met no Yes and No standards.  Here is the tiebreaker table for those teams:


According to this table, Virginia, Arkansas, and Stanford join Florida State as #2 seeds.

#3 Seeds (Candidate Pool #1 through #23)


Duke is a clear #2 seed.  St. Louis and Penn State both meet Yes and No standards.  Michigan State, Pittsburgh, South Carolina, and Ohio State meet no Yes and No standards.  Here is the tiebreaker table:


According to the table, St. Louis, Michigan State, and Penn State join Duke as #3 seeds.

#4 Seeds (Candidate Pool #1 through #26


There are no clear #4 seeds.  Here is the tiebreaker table for the potential #4s:


According to the table, Pittsburgh, South Carolina, Northwestern, and Harvard are the #4 seeds.

Automatic Qualifiers

Here are the simulated Automatic Qualifiers:


At Large Selections (Candidate Pool #1 through #57, but expanded to #60)


According to the table, Clemson, Ohio State, LSU, Arizona State, Rutgers, Southern California, Portland, Tennessee, Xavier, Texas, NC State, Georgia, and Wake Forest are clear at large selections.  Virginia Tech, Quinnipiac, Santa Clara, and Auburn meet both Yes and No standards (although Auburn, at #59, is outside the historic range for at large selections).  Texas A&M, California, and Pepperdine meet no Yes and No standards.  If all of these teams get at large selections, the number still will be two short of the number needed to fill the bracket.  Thus it will be necessary to go farther down on the list, to teams that meet no Yes but some No standards.

To address this situation, I applied the tiebreaker for at large selections to the teams that meet Yes and No standards, the teams that meet no Yes and No standards, and the teams on the list through Vanderbilt.  From the list, the top 9 teams fill the bracket.


Of note, Quinnipiac has a #48 rank plus a win against Fairfield, who finishes at #40 in the simulation.

In addition, Auburn, the last team in, is ranked #59, outside the historic range for at large selections.  If the Committee were to stay within its historic range, Wisconsin at #54, would get the last at large position instead of Auburn, since Vanderbilt is at #60.

CURRENT ACTUAL RPI RATINGS FOR GAMES THROUGH OCTOBER 23

Use the following link for access to an Excel workbook with actual RPI ratings and ranks and other data for teams based on games through October 23, 2022: RPI Report 10.23.22. On the left of the RPI Report sheet, there are five color coded columns.  These columns are based on the seasons from 2007 to the present (excluding the 2020 Covid-constrained season).  They show the rank ranges as of this stage of the season from which #1 through #4 seeds have come.  They also show the at large bubble range and that teams ranked #22 or better as of this stage of the season always have gotten at large selections.

If you compare the ratings and ranks in the Report to those published by the NCAA, you may see a few small differences.  There are two games played on October 23 that are in the NCAA data base as played later: Central Michigan v Kent State and Stonehill v St. Francis Brooklyn.  Because of this, the games are not in the data base the NCAA used for its October 23 ratings and ranks.  If these games had been entered with the correct dates, the NCAA’s and my ratings and ranks would have matched exactly.  (I verified this by deleting the games from my October 23 data base and recomputing the RPIs.  With the games deleted, the two sets of RPIs match.)

Monday, October 17, 2022

CURRENT ACTUAL RPI RATINGS FOR GAMES THROUGH OCTOBER 16

Use the following link for access to an Excel workbook with actual RPI ratings and ranks and other data for teams based on games through October 16, 2022: RPI Report 10.16.22. On the left of the RPI Report sheet, there are five color coded columns.  These columns are based on the seasons from 2007 to the present (excluding the 2020 Covid-constrained season).  They show the rank ranges as of this stage of the season from which #1 through #4 seeds have come.  They also show the at large bubble range and that teams ranked #22 or better as of this stage of the season always have gotten at large selections.

If you compare the ratings and ranks in the Report to those published by the NCAA, you may see a few small differences.  The October 16 game of Murray State 1 v Valparaiso 2 is in the NCAA data base as an October 18 game (with the result already entered).  Because of this, the game is not in the data base the NCAA used for its October 16 ratings and ranks.  If this game had been entered with the correct date, the NCAA’s and my ratings and ranks would have matched exactly.  (I verified this by deleting the game from my October 16 data base and recomputing the RPIs.  With the game deleted, the two sets of RPIs match.)

END OF SEASON ARPI RANKS USING ACTUAL RESULTS OF GAMES PLAYED THROUGH OCTOBER 16 AND SIMULATED RESULTS OF FUTURE GAMES

Below are simulated end-of-season Adjusted RPI ranks using the actual results of games played through Sunday, October 16 and simulated results of games not yet played.  The simulated results of games not yet played are based on the October 16 new ARPI ratings of the opposing teams as adjusted for home field advantage.


EVALUATION OF TEAMS FOR NCAA TOURNAMENT PURPOSES BASED ON ACTUAL RESULTS OF GAMES THROUGH OCTOBER 16 AND SIMULATED RESULTS OF FUTURE GAMES

Below are tables showing simulated seed and at large selection candidate groups based on the actual results of games played through October 16 and simulated results of games not yet played.

For the candidate groups for seeds and at large selections, each table shows how many historic patterns each team meets indicating that the team will or will not get a positive decision from the Committee.  In addition, I have indicated potential Committee decisions based on the patterns.  If there are positions open for which there are not clear seeds or at large selections, an additional table shows a potential basis for filling those positions.  Each set of tables simply reflects Committee decision patterns from 2007 to the present.

Since this year the Committee also will be seeding teams #17 through #32 (in four seed pods designated #5 through #8 seeds).  I have included a further table showing data on who those teams might be, using the assumption that the basis for their selection will be the same as the basis for selecting at large participants.

To be clear:  All of the seeds and at large selections shown below are based on the assumption that all teams, through the end of the season, will perform in accord with their current ARPI ratings.

Reminder:  From among the teams that are not automatic qualifiers, the Committee will pick 33 at large participants.

#1 Seeds


The historic candidate pool for #1 seeds is the teams ranked #1 through #7.  As the table shows, five of these teams meet criteria that always have earned teams #1 seeds.  Two meet criteria for teams that never have gotten #1 seeds.  Since there are only four #1 seed slots, it is necessary to leave one of the five "Yes" teams not getting a #1 seed.  For situations like this, for each seed position and for at large selections, I have identified the most powerful factor related to that decision -- the one that is the most consistent with past Committee decisions where it is not clear who should fill a slot.  Where there are a number of equally powerful factors, I simply have picked one of them.  For #1 seeds, the factor is Head to Head v Top 60 Rank (based on my own scoring system).  Here is a table showing how the five "Yes" teams come out using that factor:


Based on this table, in the previous table I designated the teams ranked #1 through #4 in the 1 Seed Tiebreaker Rank column as #1 seeds:  Alabama, UCLA, Notre Dame, and Florida State.

#2 Seeds


The historic candidate pool for #2 seeds is the teams ranked #1 through #14.  The table shows that after bypassing the already selected #1 seeds, North Carolina, Arkansas, and Duke are clear #2 seeds.  Since St. Louis meets both "Yes" and "No" standards for a #2 seed and Rutgers meets only one "No" standard, I moved to the Tiebreaker factor for #2 seeds, which is ARPI Rank combined with Top 50 Results Rank:


This suggests that St. Louis gets the remaining #2 seed.  As a further check, I looked to see what #2 seed "No" standards St. Louis meets.  They all relate to the Atlantic 10 average ARPI and its rank as a conference -- #10.  Simply, the Atlantic 10 is the #10 ranked conference and historically no conferenced ranked #9 or poorer has had a team get a #1 or #2 seed.  Thus if the situation on decision day matches the situation today, we will get an insight into the Committee mind:  For a team that otherwise always would have gotten a #2 seed, will the Committee deny a #2 seed simply because its conference is ranked #10.

#3 Seed


The historic candidate pool for #3 seeds is the teams ranked #1 through #23.  The table shows that after bypassing the already selected #1 and #2 seeds, Stanford, Virginia, and Pittsburgh are clear #3 seeds.  Penn State looks preferable to Southern California, but I decided to run a Tiebreaker check:


The Tiebreaker check confirms that Penn State gets the #3 seed.

#4 Seed


The historic candidate pool for #4 seeds is the teams ranked #1 through #26.  The table shows that after bypassing the already selected #1, #2, and #3 seeds, Rutgers and Southern California are clear #4 seeds.  Harvard is close but meets two "No" standards, which appear primarily related to two poor results:  a loss to Boston University in the #101 to #150 rank area and a tie with Penn in the #151 to 200 rank area.  Since there are two open positions, I checked the #4 seed tiebreaker for Harvard and the teams meeting no "Yes" and no "No" standards.


This table suggests that Michigan State and Harvard get the two open #4 seed positions.

At Large


The historic candidate pool for at large selections is the teams ranked #57 or better, but to be on the safe side I extended that up to #60.  In the table, the number 5 in the NCAA Seed or Selection column means the team is an unseeded Automatic Qualifier; 6 means the team is an at large selection; and 7 means the team gets left out.  The table shows that after bypassing the already selected #1, #2, and #3 seeds and discounting the Automatic Qualifiers, the teams from Northwestern through Xavier and from LSU through California are clear at large selections.  The teams from Oregon through Dayton are clear not at large selections.  This leaves Virginia Tech with 9 "Yes" and 3 "No" standards, Wake Forest with 1 "Yes" and 2 "No" standards, and Georgia, Santa Clara, Wisconsin, Pepperdine, and Washington State with no "Yes" and no "No" standards.  And, since Wake Forest has a net deficit of one "No," I decided to also look at VCU with its one "No."  Putting all of these teams into the at large tiebreaker competition:


Since there are seven at large positions to fill from these eight teams, the table indicates that Washington State is the team left out.

#17 through #32 Seeds

There are no historic patterns to rely on for who will be the #17 through #32 seeds.  One possibility is that those seeds will reflect the same kind of thinking as reflected in the at large selections.  If so, here is a table of the unseeded teams, after culling out the Automatic Qualifiers who meet more "No" than "Yes" standards:


Monday, October 10, 2022

CURRENT ACTUAL RPI RATINGS FOR GAMES THROUGH OCTOBER 9, 2022

 Use the following link for access to an Excel workbook with actual RPI ratings and ranks and other data for teams based on games through October 9, 2022: RPI Report 10.9.22. On the left of the RPI Report sheet, there are five color coded columns.  These columns are based on the seasons from 2007 to the present (excluding the 2020 Covid-constrained season).  They show the rank ranges as of this stage of the season from which #1 through #4 seeds have come.  They also show the at large bubble range and that teams ranked #17 or better as of this stage of the season always have gotten at large selections.

SIMULATED END OF SEASON ARPI RATINGS USING ACTUAL RESULTS OF GAMES THROUGH OCTOBER 9 AND SIMULATED RESULTS FOR FUTURE GAMES

Below are simulated end-of-season Adjusted RPI ranks using the actual results of games played through Sunday, October 9 and simulated results of games not yet played.  The simulated results of games not yet played are based on the current actual ARPI ratings of the opposing teams as adjusted for home field advantage.


EVALUATION OF TEAMS FOR NCAA TOURNAMENT PURPOSES BASED ON ACTUAL RESULTS OF GAMES THROUGH OCTOBER 9 AND SIMULATED RESULTS OF FUTURE GAMES

Below are tables showing simulated seed and at large selection candidate groups based on the actual results of games played through October 9 and simulated results of games not yet played.  There also is a table showing simulated conference champion automatic qualifiers.  For the candidate groups for seeds and at large selections, each table shows how many historic patterns each team meets indicating that the team will or will not get a positive decision from the Committee.  In addition, I have indicated potential Committee decisions based on the patterns.

I also have included some discussion to help readers understand how different considerations go into the decision process.  The discussion is only to help with understanding, as the numbers in the tables will be different at the end of the season.

Reminder:  From among the teams that are not automatic qualifiers, the Committee will pick 33 at large participants.

#1 Seeds


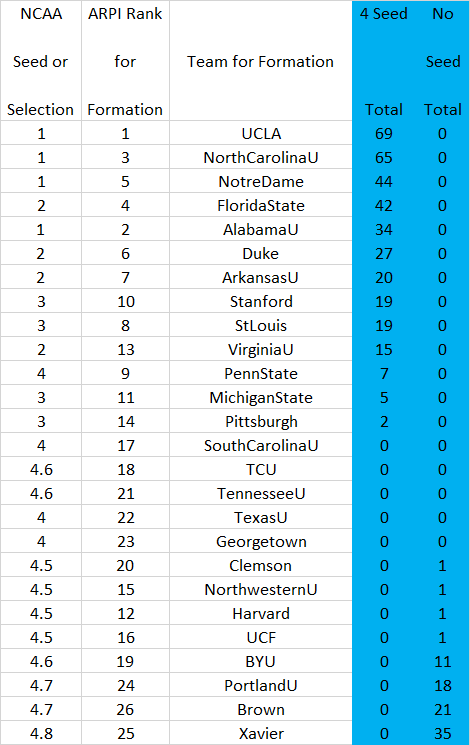
Historically, the #1 seeds have come from teams with ARPI ranks 1 through 7.  The 1 Seed Total column shows the number of standards a team has met where a team meeting any one of the standards always has gotten a #1 seed.  The No 1 Seed Total column is where meeting any one of the standards means the team never has gotten a #1 seed.

Since Virginia meets both yes and no standards, it has a profile the Committee has not seen before.  I took a look at the no standards, to see what is negative about Virginia’s profile so far as a #1 seed is concerned.

One of the no standards combines RPI rank and conference standing, with each weighted at 50%.  In the conference regular season standings, the simulation has Virginia finishing tied for 3rd and thus splitting the 3-4 positions.  I treat this as finishing in position 3.5.  In the conference tournament, the simulation has Virginia losing in the semi-finals.  I treat both losing semi-finalists as splitting the 3-4 tournament positions, thus finishing in position 3.5.  I then average the regular season standing and conference tournament finishing position which, in this case, comes out to 3.5 for Virginia.  When I combine this with its #7 RPI rank, Virginia ends up with a score that is outside the range of teams that historically have gotten #1 seeds.

The other two no standards combine RPI rank with a poor results score and a poor results rank, respectively.  In the simulation, the Virginia poor results score is -3, coming from its recent tie with Syracuse, which the simulation has ending the season ranked #126.  Based on this, its poor results rank is #22.  It is worth noting that statistically, for teams competing for as yet unfilled #1 seeds, poor results are one of the best correlators with Committee decisions.

In light of this, if the simulation results were the actual results in front of the Committee on decision day, UCLA, Alabama, and North Carolina would seem like clear #1 seeds, with Virginia, Notre Dame, and Duke as possibilities to fill the fourth position.  The Committee then would have to decide how to treat Virginia, given its unique profile.

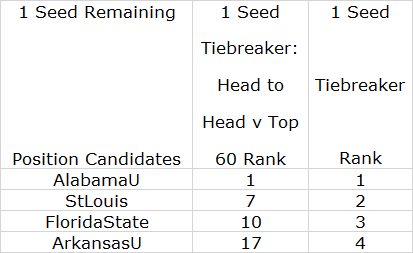
My suspicion is that, in this scenario, the Committee would give #1 seeds to UCLA, Alabama, North Carolina, and Notre Dame.

#2 Seeds


Historically, the #2 seed pool is teams ranked #14 or better.  If the top 4 in this table have #1 seeds as I have suggested, then Virginia, Duke, and Arkansas are clear #2 seeds.  This leaves St. Louis, Florida State, and Pittsburgh as possibilities to fill the last position.  On looking at the St. Louis no standards, they all have to do with the Atlantic 10 conference -- either the conference average RPI or the conference RPI rank, which the simulation has as #10.  Since 2007 (excluding Covid-affected 2020), no team from a conference ranked #9 or poorer has gotten a #1 seed.  On the other hand, the St. Louis yes standards relate to its having had no poor results and its having had good results, on average, in its games against Top 60 opponents (6 games).

In this scenario, I suspect the Committee would give the last #2 seed to Florida State.

#3 Seeds


Historically, the #3 seed pool is teams ranked #23 or better.  In this table, if the top 8 have #1 or #2 seeds, I see the Committee giving #3 seeds to Pittsburgh and St. Louis.  This would leave 2 open positions for South Carolina, Penn State, Rutgers, and Northwestern as candidates.  For #3 seeds, in filling open positions, the historically best tie-breaker has been a standard that combines team RPI rating and Top 60 Head to Head Score Rank.  The two teams that score best on this are South Carolina and Rutgers.  Thus I suspect the Committee would give them #3 seeds.

#4 Seeds


Historically, the #4 seed pool is teams ranked #26 or better.  In this table, after taking out the #1 through #3 seeds, it looks like Penn State and Harvard are likely #4 seeds.  The last two seeds should come from Northwestern, Portland, Texas, Xavier, and Georgetown.  For #4 seeds, in filling open positions, the historically best tie-breaker has been a standard that combines team Top 50 Results Score and Top 60 Common Opponents Score.  The two teams that score best on this are Nothwestern and Georgetown.  Thus I suspect the Committee would give them #4 seeds.

Automatic Qualifiers

Here is a list of the automatic qualifiers the simulation currently produces:
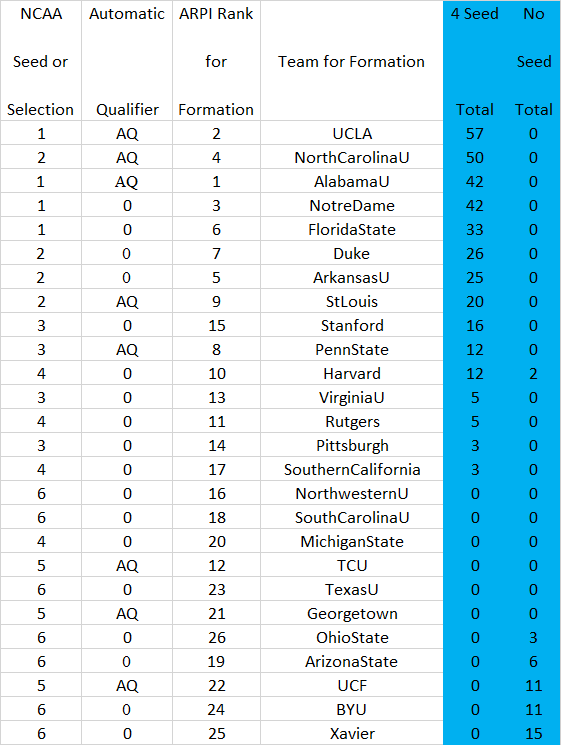

At Large

Here is a table showing seeds, automatic qualifiers, at large selections, and Top 60 teams not getting at large selections.  In the table:

1 = #1 seed

2 = #2 seed

3 = #3 seed

4 = #4 seed

5 = unseeded automatic qualifier

6 = unseeded at large selection

7 = Top 60 team not getting an at large selection


The at large selections are pretty clear, with one exception: Virginia Tech.  Its most obvious problem is that it has a #59 RPI rank, and since 2007 no team ranked #58 or poorer has gotten an at large selection.  On the other hand, its most obvious plus is that it has the #11 ranked Top 50 Results Score (using my scoring system).  In the simulation, this comes mostly from a win over North Carolina, which I have as a #1 seed.  So the Committee question is this:  Are we going to exclude a team because it is ranked #59, when it has shown it is able to compete at the level of our #1 seeds?  I suspect the Committee would give Virginia Tech an at large position, as assigned in the above table.

Monday, October 3, 2022

CURRENT ACTUAL RPI RATINGS FOR GAMES THROUGH OCTOBER 2

Use the following link for access to an Excel workbook with actual RPI ratings and ranks and other data for teams based on games through October 2, 2022: 2022 RPI Report 10.2.22.  On the left of the RPI Report sheet, there are five color coded columns.  These columns are based on the seasons from 2007 to the present (excluding the 2020 Covid-constrained season).  They show the rank ranges as of this stage of the season from which #1 through #4 seeds have come.  They also show the at large bubble range and that teams ranked #10 or better as of this stage of the season always have gotten at large selections.

Strictly from a nerdy statistics perspective, I saw something interesting today.  The NCAA has Western Kentucky with an Adjusted RPI rating 0.0016 better than I do -- notwithstanding that our ratings match for every other team.  After some detective work, I saw that the NCAA has both Kansas and Kentucky ranked as #80 in the unadjusted RPI.  Western Kentucky has a home win against Kentucky.  This means that it receives an 0.0016 bonus for that win, if Kentucky is ranked #80.  I, on the other hand, have Kentucky ranked #81 in the URPI, which means no bonus for Western Kentucky because the bonus tiers are for wins or ties versus teams ranked #1 through #40 and #41 through #80.  Why do the NCAA and I have that difference?  The NCAA rounds its ratings to five decimal places, at least for purposes of rankings, which gives Kansas and Kentucky identical ratings so that both fill the #80 slot.  I, on the other hand, round off at far more decimal places, which give Kansas a very slightly better rating than Kentucky and thus has Kentucky ranked #81.  The interesting thing to the statistics nerd in me is to establish that the NCAA rounds to five decimal places for ranking purposes.  I suspect, but do not know, that they do this for all calculation purposes.

SIMULATED END OF SEASON ARPI RANKS USING ACTUAL RESULTS OF GAMES PLAYED THROUGH OCTOBER 2 AND SIMULATED RESULTS OF FUTURE GAMES

Below are simulated end-of-season Adjusted RPI ranks using the actual results of games played through Sunday, October 2 and simulated results of games not yet played.  The simulated results of games not yet played are based on the current actual ARPI ratings of the opposing teams as adjusted for home field advantage.

Since I have had questions in prior weeks about why Florida State is so far down on the list -- it is at #28 this week -- here is a brief explanation of why:

Its current RPI rating has it ranked #16.  The reason its current rating is not better is that it has had a relatively weak strength of schedule so far, as the RPI measures strength of schedule.  When I plug in ratings for all of the teams and apply them to future games, Florida State ends up with an end-of-season record of 9-4-4.  Although some, perhaps many, believe they will end with a better record, 9-4-4 is what their current RPI says.  With that record and the records of the other teams around them, combined with their strengths of shedule, Florida State ends up at #28.  If those who doubt this are right and Florida State does better than current ratings say they will do, then when they do that the system will adjust and will have them ending up with a better ending rank.


EVALUATION OF TEAMS FOR NCAA TOURNAMENT PURPOSES BASED ON ATUAL RESULTS OF GAMES THROUGH OCTOBER 2 AND SIMULATED RESULTS OF FUTURE GAMES

Below are tables showing simulated seed and at large selection candidate groups based on the actual results of games played through October 2 and simulated results of games not yet played.  There also is a table showing simulated conference champion automatic qualifiers.  For the candidate groups for seeds and at large selections, each table shows how many historic patterns each team meets indicating that the team will or will not get a positive decision from the Committee.

For the at large selection table, although all at large selections historically have come from teams ranked #57 or better, I have included teams ranked #60 or better.

Reminder:  From among the teams that are not automatic qualifiers, the Committee will pick 33 at large participants.

#1 Seeds


In this table, Alabama is an interesting case study.  The number 4 in the 1 Seed Total column means that its profile has four characteristics where teams with those characteristics always have gotten #1 seeds.  On the other hand, the number 12 in the No 1 Seed Total column means it has 12 characteristics where teams with those characteristics never have gotten at large selections.  What Alabama’s having numbers in both columns means is that if this were to continue to the end of the season, it would have a profile that the Committee has not seen from 2007 to now.  Although this situation probably will clear up by the end of the season, I was curious to see what its No 1 Seed characteristics are.  On checking, they all are related to poor results (for a #1 seed): It has a tie at Utah (ranked in the #51 to #100 range) and a loss at Miami, FL (ranked in the #101 to #150 range).  In the poor results scoring system I use, this gives them a poor results score of -5 and a poor results rank of #34.  Since 2007, teams with that score or that rank never have gotten a #1 seed.  This accounts for 2 of its 12 No 1 Seed characteristics.  All of its other No 1 Seed characteristics are combinations of other profile aspects the Committee considers with either the poor results score or the poor results rank.  This means that the other aspects of its profile and not good enough to overcome the poor results, from a #1 seed perspective.

#2 Seeds


#3 Seeds


#4 Seeds


Automatic Qualifiers


At Large

There will be 33 at large teams.  Since 2007, teams ranked #30 or better always have gotten at large selections.  Teams ranked #58 and poorer never have gotten at large selections.  So, the likely bubble group is teams ranked #31 to #57.