Below are tables showing simulated seed and at large selection candidate groups based on the actual results of games played through October 23 and simulated results of games not yet played.
For the candidate groups for seeds and at large selections, each table shows how many historic patterns each team meets indicating that the team will or will not get a positive decision from the Committee. In addition, I have indicated potential Committee decisions based on the patterns. If there are positions open for which there are not clear seeds or at large selections, an additional table shows a potential basis for filling those positions. Each set of tables simply reflects Committee decision patterns from 2007 to the present.
Since there are no historic data showing how the Committee seeds teams #17 through #32 (in four seed pods designated #5 through #8 seeds), I have decided not to try to guess how the Committee will do that.
To be clear: All of the seeds and at large selections shown below are based on the assumption that all teams, through the end of the season, will perform in accord with their current ARPI ratings as adjusted for game locations. Further, they are based on Committee historic patterns. Based on what I am seeing so far, it appears this is an unusual year. I do not know why, but perhaps it is due to the Covid aftermath or increased parity, or both. It also may be due to the no overtime rule, although a study I have done suggests the change to no overtime should not make a big difference. Whatever the reason, however, it is possible Committee historic patterns will not hold up this year.
Reminder: From among the teams that are not automatic qualifiers, the Committee will pick 33 at large participants.
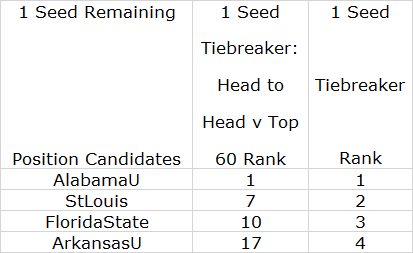
#1 Seeds (Candidate Pool #1 through #7)

#2 Seeds (Candidate Pool #1 through #14)


Duke is a clear #2 seed. St. Louis and Penn State both meet Yes and No standards. Michigan State, Pittsburgh, South Carolina, and Ohio State meet no Yes and No standards. Here is the tiebreaker table:


There are no clear #4 seeds. Here is the tiebreaker table for the potential #4s:

According to the table, Pittsburgh, South Carolina, Northwestern, and Harvard are the #4 seeds.


According to the table, Clemson, Ohio State, LSU, Arizona State, Rutgers, Southern California, Portland, Tennessee, Xavier, Texas, NC State, Georgia, and Wake Forest are clear at large selections. Virginia Tech, Quinnipiac, Santa Clara, and Auburn meet both Yes and No standards (although Auburn, at #59, is outside the historic range for at large selections). Texas A&M, California, and Pepperdine meet no Yes and No standards. If all of these teams get at large selections, the number still will be two short of the number needed to fill the bracket. Thus it will be necessary to go farther down on the list, to teams that meet no Yes but some No standards.

Of note, Quinnipiac has a #48 rank plus a win against Fairfield, who finishes at #40 in the simulation.
No comments:
Post a Comment