This is a review of how teams from the different regions and conferences do in NCAA Tournaments, as compared to how the Women's Soccer Committee expects them to do as indicated by its bracketing decisions. The review covers the period from 2011 to 2023. It starts at 2011 because in 2010 and earlier, seeded teams were not guaranteed to host first round games.
The review method assumes that for any pairing of teams:
1. In a game between a seeded team and an unseeded team, the Committee expects the seeded team to win;
2. In a game between two seeded teams, the Committee expects the better seeded team to win;
3. In a game between unseeded teams where the Committee awards one of them home field, the Committee expects the home team to win; and
4. In a game between unseeded teams at a neutral site, the Committee has no expectation as to which team will win.
The review looks at the data through three lenses:
1. Actual Games Played. It looks at games teams actually played:
a. For each game, it compares the Committee's expected result to the actual result.
b. For each team, for the games it played, it then tallies its expected wins and its actual wins.
c. For each team, it then subtracts its expected wins from its actual wins. If the result is a + number, it means the team won that many more of its games than the Committee expected. If the result is a - number, it means the team won that many fewer.
d. It then sums up the results from Step c by region and by conference, to see what the regions' and conferences' net results in actual games have been as compared to the Committee's expectations.
e. It then expresses the results from Step d as a percentage of all games the region's or conference's teams played.
2. Expected Games. It looks at how the Committee initially expected the bracket to play out:
a. For each team, it looks at the number of games the Committee expected the team to win over the course of the Tournament. For example, the Committee expects the overall #1 team (top left of the bracket) to win the championship, which means winning 6 games. It expects the overall #2 team (bottom right) to win 5 games.
b, For each team, it tallies the number of games it actually won.
c. For each team, it then subtracts its expected wins from its actual wins.
d. It then sums up the results from Step c by region and by conference, to see what the regions' and conferences' actual results have been as compared to the results the Committee expected them to have over the course of the Tournament.
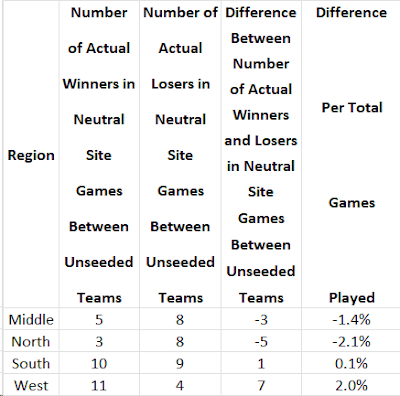
3. Unseeded Opponents at Neutral Sites. Method 1 leaves out one set of games: those between unseeded opponents at neutral sites. In each of these games, at least one of the opponents has upset its opponent in a preceding round. Since neither team is seeded and the game is at a neutral site, it is not possible to say that the Committee expected one or the other team to win. On average, there are 2 to 3 games per year in this category. For these games:
a. For each region and conference, it sums up the number of games its teams won and the number they lost.
b. For each region and conference, it then subtracts its number of games lost from its number of games won. A + result means the region or conference won that many more than it lost and a - result means it lost that many more than it won.
c. It then expresses the results from Step b as a percentage of all games the region's or conference's teams played.
Here are the results of the review, first by regions and then by conferences:
Regions
Teams' regions are based on the states where they are located. The states are assigned to the regions in which the states' teams play the majority (or plurality) of their games.
Actual Games Played Method
Using the Middle region as an example, from 2011 through 2023, the net difference between the games it actually won and the games the Committee expected it to win is 10. In other words, it won 10 more games than the Committee expected. Its teams played a total of 215 games. So its winning 10 more games than expected represents it performing better than the Committee expected in 4.7% of its games.
An important feature of this and all the other methods is that the net differences always represent games against teams from other regions. This is because in games between two teams from the same region, if one unexpectedly wins a game then the other unexpectedly loses and the win and loss cancel each other out thus producing a net difference of 0 for that game.
The notable feature of this table is that the Middle, North, and West regions all have positive net differences. The South region has a negative net difference.
Expected Games Method
Here, the results are similar, but not identical, to those for the Actual Games Played method. Again, the Middle, North, and West region have positive net differences. The South has a negative net difference.
Unseeded Opponents At Neutral Sites Method
The notable feature of this table is that the West region teams tend to prevail in these games, at the expense of teams from the Middle and North regions.
Conferences
Actual Games Played Method
In the table, I have arranged the conferences in order with those that have won the highest percentage of games, as compared to expected wins, at the top.
The table covers 12 years of games. Some conferences show fewer than 12 games due to conference membership changes over the 2011 to 2023 time frame. For the conferences that have few games, I tend to not take the numbers very seriously -- the data sample is very small. Taking that into consideration, here is what I see in the numbers from the other conferences:
- Tournament teams from some of the mid-majors tend to do better than the Committee expects.
- From the Power 5 conferences, the Big 10 does better than the Committee expects and the ACC does just as the Committee expects. The Pac 12 does a little more poorly than the Committee expects. The SEC and especially the Big 12 do more poorly than the Committee expects.
The table shows that the Big 10 does better than the Committee expects, followed by the Big West, West Coast, and Colonial conferences. At the other end of the spectrum, the Pac 12 and Big 12 do considerably more poorly than the Committee expects, followed by the SEC and ACC.
An interesting aspect of this table, in relation to the bracketing rules, is the relationship among the Big West and West Coast conferences on the one hand and the Pac 12 conference on the other. To a good extent, the Big West and West Coast teams' performing better than the Committee expects is at the expense of the Pac 12 conference, since the Big West and West Coast conference teams are the ones the Pac 12 teams tend to play in the early rounds of the Tournament, due to the NCAA's bracket formation rules (including the required use of the RPI and the travel expense limitation policy).
Another interesting aspect is that the Big 10 performs better than the Committee expects, but the other Power 5 conferences perform more poorly.
Unseeded Opponents At Neutral Sites MethodThe notable feature from this table is that the Big West, West Coast, and Pac 12 conferences perform the best in these games. They all are from the West region. Teams from the other 4 Power 5 conferences perform at or close to a 50-50 ratio. The West region conferences' good performance is balanced out by weak performance by teams from non-Power 5 conferences.
Summary and Comment
Looking at regions, teams from the South perform more poorly than the Committee expects.
Looking at conferences:
Although most of the ACC teams are in the South, its teams perform about as the Committee expects. The SEC and Big 12, on the other hand, perform more poorly than the Committee expects.
From the West, the Big West and West Coast conferences perform better than the Committee expects, apparently at the expense of the Pac 12. This suggests an unusually high degree of parity in the West. Coupled with the other numbers above, it appears that the NCAA bracketing rules do not do well when there is a high degree of parity in a region.
From the Middle, teams from the Big 10 perform better than the Committee expects.
Comment: Altogether, the numbers suggest that the NCAA bracketing rules result in there not being equal treatment among the regions and among some of the stronger conferences. The Committee could improve on this by tracking "longitudinal" data and results such as I have done here and taking the data and results into consideration during the bracketing process.