Monday, March 29, 2021

NCAA TOURNAMENT: HOW IN THE WORLD IS THE COMMITTEE GOING TO MAKE AT LARGE SELECTIONS? PART 4 - AS OF MARCH 28

In the three preceding articles of this series, I discussed the problems with the RPI this year and an alternative way for the Committee to make its 19 at large selections for the NCAA Tournament without using the RPI.  The alternative goes through the following steps:

Allocates the 16 seed positions -- Tier 1 -- to conferences based on the average numbers of seeds they have had over the years since 2013 (the year of completion of the most recent major conference realignment).

For the next 16 positions -- Tier 2 -- allocates them to conferences based on the average number of first round home games their unseeded teams have had over the years since 2013.  (This results in more teams in Tiers 1 and 2 combined than will be needed to fill the 19 at large positions, even after taking Tier 1 and 2 automatic qualifiers into consideration.)

Creates a third group -- Tier 3 -- allocated to conferences to bring them up to the maximum number of teams they have had either seeded or unseeded but with first round home games over the years since 2013 -- as distinguished from the average number of teams.

With the three tiers in place with their assigned conference slots, the next step is to do an initial fill of the slots with teams from the conferences.  For each conference, the basis for initially filling the slots is team actual in-conference results during the current season.  To do this initial fill, I assign each team a rank in its conference, based on where it finished in its conference regular season and where it finished in its conference tournament, with those two finishing positions weighted 50-50.  If the conference does not have a tournament, then I assign the team the rank it had in its conference regular-season competition.  Due to there being so many canceled games this season, I do the conference regular season rankings based on points per game.  Once I have the assigned ranks of teams within their conferences, I then fill the conference tier slots starting with Tier 1, then Tier 2, then Tier 3.

I then look to see if any Tier 3 teams should trade places with any Tier 2 teams.  Any replacement must be based exclusively on team results this season.  After completing that step, I look to see if any Tier 2 teams should trade places with any Tier 1 teams, again based exclusively on team results this season.

When I have finalized Tiers 1 and 2, then the Tier 1 teams will be the 16 seeded teams.  I count the number of Tier 1 teams that are not automatic qualifers and subract that number from 19 to tell me the number of automatic qualifiers that will come from Tier 2.  Most likely, this will be 3 fewer than the number of Tier 2 teams that are not themselves automatic qualifiers.  This means I will have to eliminate 3 of the Tier 2 teams.  This elimination must be based exclusively on team results this season.

When I am done, I have selected 19 at large teams and they, together with the 29 automatic qualifiers, will make up the tournament field.

This process, applied to the actual results of games played through Sunday, March 28, combined with simulated results for all games not yet played including simulated conference tournaments, produces the following initial tiers of teams.  As future actual results replace simulated results, the teams in the tiers will change.  (The simulated results are right roughly two-thirds of the time.)  Thus it is best to view the current three tiers as illustrating an historically appropriate distribution of slots among conferences, rather than focusing on the particular teams currently in those slots.  In addition, since these are only the initial tiers, they would be subject to the review and potential trading of teams between tiers process I have described above.  The yellow highlighted teams are actual or simulated automatic qualifiers.


I will update this table weekly over the closing weeks of the season.

NCAA TOURNAMENT: KEEPING THE RPI HONEST, PART 6

In Parts 1 and 2 of this series, I described a test to see if this year’s RPI will be usable.  The test compares the Top 60 and Top 30 in the RPI rankings to baselines for the Top 60 and Top 30 derived from 2013 to the present.  It looks at two groups of conferences: a highlighted group consisting of the eight conferences that have had at least one team in the Top 60 every year since 2013 (ACC, American, Big East, Big 10, Big 12, Pac 12, SEC, West Coast) and a not-highlighted group consisting of all the other conferences.  The test shows the average number of teams and the high and low number of teams each group has had in the Top 60 and Top 30 since 2013.  It asks the question of how the numbers for the RPI ranks this year compare to the test period numbers.

Top 60 Test:  The RPI Top 60 should include roughly 49 teams from the highlighted conferences and 11 teams from the not-highlighted conferences.  The actual numbers can range on either side of these test numbers, but 45 teams should be the minimum from the highlighted group and 15 the maximum from the not-highlighted group.

Top 30 Test:  The RPI Top 30 should include roughly 28 teams from the highlighted conferences and 2 teams from the not-highlighted conferences.  The actual numbers can range on either side of these test numbers, but 27 teams should be the minimum from the highlighted group and 3 the maximum from the not-highlighted group.

Here are three different looks at how these tests apply to the current season, for games played through Sunday, March 28.

 ACTUAL RPI, TO DATE

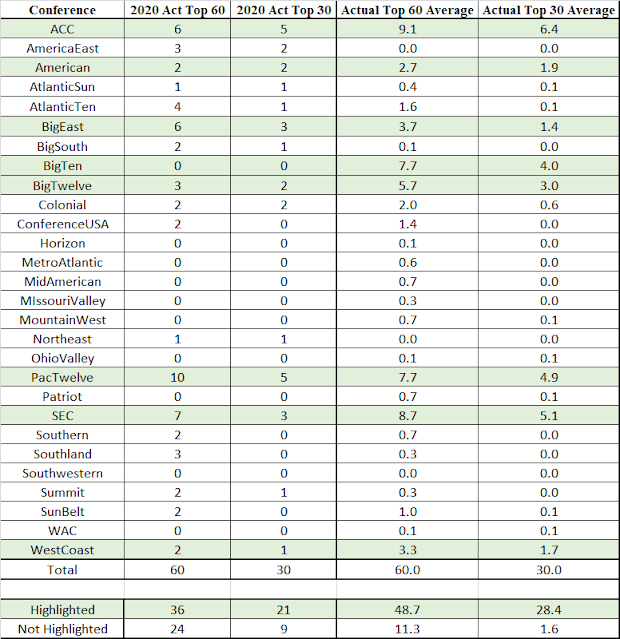
The following table shows conference representation in the RPI Top 60 and Top 30, plus totals for the highlighted and not-highlighted conferences at the bottom.  The left portion of the table is based on actual RPI ranks, to date, and the right portion of the table has the historic baseline test numbers.


The following table is similar but for regional playing pools:


ACTUAL RPI, TO DATE, CONFERENCES PLAYING SOME NON-CONFERENCE GAMES

Here are similar tables, but for this year’s RPI Top 60 and Top 30 if I consider only conferences playing at least some non-conference games.  I include these tables because it is indisputable that for conferences that play no non-conference games, the RPI cannot rank their teams in relation to teams from other conferences.


SIMULATED RPI, USING ACTUAL RESULTS TO DATE

Here are similar tables, but based on the entire season, including conference tournaments.  Their underlying data are the actual results of games played through March 28 plus simulated results of future games.  These should give a pretty reliable picture of what the end-of-season numbers will look like.


COMMENT

As the above tables show, the RPI is going to greatly underrate teams from stronger conferences and regions and greatly overrate teams from weaker conferences and regions.  This is due to teams not playing enough total games, not playing enough non-conference games, and not playing enough out-of-region games.  Further, it is true even if one considers only teams from conferences that are allowing members to play non-conference games.

Monday, March 22, 2021

NCAA TOURNAMENT: HOW IN THE WORLD IS THE COMMITTEE GOING TO MAKE AT LARGE SELECTIONS? PART 1 - RPI OR NO RPI?

The Women’s Soccer Committee will face major challenges this year in making the 19 at large selections for the NCAA Tournament.

Two NCAA requirements that apply to normal years may create big problems this year:

Policy Against Using Past Years’ Performance.  The NCAA has a policy that the Committee cannot consider past years’ performance in making at large selections.  Rather, selections must be based only on teams’ performance this year.

Use of the RPI.  The only statistical rating system the Committee is allowed to consider is the RPI.  In addition, it cannot consider polls.

These requirements create a problem: The RPI depends on teams playing enough games and sufficient proportions of non-conference and out-of-region games.  Teams this year likely will play neither enough games nor sufficient proportions of non-conference and out-of-region games for the RPI to work.  If that happens, what is the Committee to do?

Here are some thoughts on this question:

Conference-Only Conferences.  Seven conferences are playing conference-only schedules:  Big Ten, Horizon, Metro Atlantic, Mid American, Mountain West, Ohio Valley, and Patriot (except for Navy, which played three Fall non-conference games, 2 against Pittsburgh and 1 against Virginia Tech).  The problem with this is: If a conference has a conference-only schedule, it is impossible for any statistical rating system to rate the conference’s teams in relation to the teams of other conferences.  Thus the RPI rankings for teams from these conferences will be meaningless in relation to the rankings of teams from other conferences.

Given this, if you cannot refer to history, you have no way to know where the teams of a conference-only conference fit in comparison to teams from other conferences.

What if you refer to history regarding this year’s conference-only conferences?

Based on past seasons since 2013, 6 of the 7 conference-only conferences are not strong enough to get any at large selections, as they have gotten no at large selections to the NCAA Tournament: Horizon, Metro Atlantic, Mid American, Mountain West, Ohio Valley, and Patriot.

The Big Ten, however, is different.  Since 2013 it has had a minimum of 5 and a maximum of 11 teams in the RPI Top 60 with an average of 7.7, of which 1 each year has been an automatic qualifier.  And, it has had a minimum of 0 and a maximum of 2 at large teams seeded, with an average of 1, which means it has had these numbers in the Committee’s actual Top 16.

Of course, regarding the conference-only conferences, the Committee could decide: If your conference went conference-only for this season, then you get only your automatic qualifier in the Tournament; you get no at large positions.  The only real alternative would be to decide: We are going to refer to past history; and you will get roughly the number of at large positions that past history indicates is appropriate for your conference.

To summarize for conference-only conferences, the Committee’s dilemma is this:  Either it gives conference-only conferences no at large positions, which will not be consistent with true conference strength so far as the Big Ten is concerned; or it uses past history as its basis for at large selections.

Conferences Playing Non-Conference Opponents.  What about teams from conferences that are playing non-conference opponents?  If you think about them as first having played all their conference games, at that point they will be in the same position as the conference-only conferences as described above.  Then, as you add non-conference games, their ratings and rankings adjust in relation to those of teams from other conferences playing non-conference opponents.  The more non-conference games you add, the more accurate the adjustments.

In a normal season, 56.0% of games are conference games and 44.0% are non-conference.  It would be better if the proportion of non-conference games were higher, but these proportions are workable given that the Committee supplements the RPI with other data-based considerations such as head to head results and results against common opponents.  This year, however, according to the schedule as of March 21, 83.3% of games will be conference and only 16.7% will be non-conference.  Or, limiting consideration to conferences playing non-conference opponents, 78.6% will be conference and 21.4% non-conference.  Thus the opportunity for ratings and ranks to adjust in relation to teams from other conferences will be less than half what it is in a normal year.  This will cause the RPI to greatly underrate teams from strong conferences and overrate teams from weak conferences.

Here again, the Committee could decide that notwithstanding the problem it is going to use the RPI ranks in the at large selection process.  If it does this, however, it is going to end up with at large selections that obiously will be not consistent with true team strength.  Alternatively, the Committee can decide the RPI is not usable and use past history as a basis for allocating at large positions to conferences and then choose teams from each conference based on their performance this year.

Regional Playing Pools.  Based on historical scheduling patterns, the Division I conferences play in four regional playing pools.  They are:

Middle: Horizon, Mid American, Missouri Valley, and Summit

Northeast: America East, Atlantic 10, Big East, Colonial, Metro Atlantic, Northeast, and Patriot [and Ivy]

South: ACC, American, Atlantic Sun, Big South, Big 10, Big 12, Conference USA, Ohio Valley, SEC, Southern, Southland, Southwestern, and Sun Belt

West: Big Sky, Mountain West, Pac 12, WAC, and West Coast [and Big West]

The situation is the same for regions as for conferences.  If you think about regions as first having played all their in-region games, at that point they will be in the same position as the conference-only conferences as described above -- there will be no way to know how each region’s teams rank in relation to teams from other regions.  Then, as you add out-of-region games, a region’s teams’ ratings and rankings adjust in relation to those of teams from other regions.  The more out-of-region games you add, the more accurate the adjustments.

In a normal year, the Middle plays 33.0% of its games out-of-region, the Northeast 17.8%, the South 14.6%, and the West 17.4%  This year, however, based on the schedule as of March 21, the Middle will play 6.0% of its games out-of-region, the Northeast 16.0%, the South 6.9%, and the West 4.4%.  These proportions of out-of-region games are not enough to allow the RPI to rank the teams from any one region in relation to the teams from the other regions.

Here again, the Committee could decide that notwithstanding the problem it is going to use the RPI ranks in the at large selection process.  If it does this, however, it is going to end up with at large selections that are not consistent with true region strength.  Alternatively, the Committee can use past history as a basis for assuring the distribution of at large allocations among regions is appropriate.

If the Committee is going to use past history to be sure it has appropriate conference and region representation in its at large selections, how can it do it?  I will address that in my next article.

NCAA TOURNAMENT: HOW IN THE WORLD IS THE COMMITTEE GOING TO MAKE AT LARGE SELECTIONS? PART 2 - THE TOP 16 TEAMS

In my preceding article, I questioned the Committee’s ability to use the RPI in this year’s at large selection process.  It may have to turn instead to past history to assure appropriate representation of conferences and regions in its selections.  In this article and the next, I will show how the Committee could make its 19 at large selections using past history to set the overall outlines of the bracket and then use specific teams’ performance this year to fill in the details.

Here are the steps the Committee could go through:

Step 1:  Decide on a group of the Top 16 teams.  These will be tentatively seeded teams, subject to changes if appropriate based on the details of this year’s game results.

For each past year, we know the teams that the Committee ranked within the Top 16 because the Committee seeded them.  The following tables shows the conference distribution of the Top 16 -- the seeds -- since 2013. The first table is for seeded automatic qualifiers, the second is for seeded at large teams, and the third combines the seeded automatic qualifiers and at large teams:


In this table, the highlighted conferences are ones that have had at least one at large selection every year since 2013.  As the table shows, on average the highlighted conferences have had roughly 5 automatic qualifiers that are seeded and the other conferences have had roughly none.  As outside limits, one would expect the highlighted conferences to have no fewer than 4 automatic qualifers seeded and no more than 7; and one would expect the other conferences to have at most 1.

As this table shows, on average the highlighted conferences have had roughly 10 to 11 at large teams that are seeded and the other conferences have had none.  As outside limits, one would expect the highlighted conferences to have no fewer than 8 at large teams seeded and no more than 12; and one would expect the other conferences to have none.


 As this table shows, on average the highlighted conferences have had all of the seeds and the other conferences have had none.  At most, the other conferences have had 1 seeded team and that happened only once.  In other words, history indicates one should expect that the Committee’s Top 16 teams all should come from the highlighted conferences, but with possibly one coming from the other conferences.

The above tables show the reasonably expected distributions of at large selections among the highlighted group and not highlighted group of conferences.  In addition, they show the historic distributions among the particular conferences.  For the conferences grouped together as highlighted, the totals are very good representations of what should be the case this year.  For the particular conferences and regions, the totals should be good, though not as good, representations of what should be the case.  This reflects the fact that although individual team strength varies from year to year, conference and region strength changes only slowly over time and highlighted group strength changes, at most, very slowly.

Thus the tables, in addition to providing a very good tentative picture of what the highlighted and not highlighted group representations should be among the 16 seeds, also provide a good tentative picture of what the individual conference representations should be.  With that in mind, here is what the tentative conference representations should be among the 16 seeds (using rounded off numbers from the above tables as needed):

ACC:  1 automatic qualifier plus 4 at large selections, but with the possibility of the at large selections ranging between 2 and 6

Big 10:  1 automatic qualifier plus 1 at large selection, but with the possibility of no automatic qualifier and of the at large selections ranging between 0 and 3

 Big 12:  1 automatic qualifier plus 1 at large selection, but with the possibility of no automatic qualifier and of the at large selections ranging between 0 and 3

Pac 12:  1 automatic qualifer plus 2 at large selections, but with the possibility of the at large selections ranging between 0 and 3

SEC:  1 automatic qualifier plus 2 at large selections, but with the possibility of no automatic qualifier and of the at large selections ranging between 0 and 4

 American:  no automatic qualifier and no at large selection, but with the possibility of 1 automatic qualifer or 1 at at large selection

Big East:  no automatic qualifier and no at large selection as the baseline, but with the possibility of 1 automatic qualifer or 1 at at large selection

 Summit:  no automatic qualifier and no at large selection, but with the possibility of 1 automatic qualifer or 1 at at large selection

West Coast:  1 automatic qualifier or 1 at large selection, but with the possibility of no automatic qualifier and no at large selection

These allocations set the tentative conference representation for the 16 seeds.  The next step is to use this year’s actual in-conference game data to decide which teams from each conference fill its seed slots.  The data to be used come from three sets of games: (a) conference regular season games that count in the conference standings, (b) conference tournament games for the conferences with tournaments, and (c) any other in-conference games.

To illustrate how filling the conference seed slots can work, I will use a simple method to rank teams within their conferences.  The teams already have their in-conference regular season ranks.  For their conference tournament ranks, I will assign the champion a rank of 1, the runner-up a rank of 2, the losing semi-finalists a rank of 3.5 (the average of the #3 and #4 positions), and other tournament participants ranks determined by the same method.  For teams not participating in the tournament, I will assign them tournament ranks the same as their regular season ranks.  I then will average the regular season and tournament ranks to get each team’s tentative rank for NCAA Tournament selection purposes.  I then will review teams’ conference games that were not counting regular season or conference tournament games and make rank changes they indicate are appropriate, if any.

Since the season still is underway, I am going to simulate where teams will be at the end of the season to show how this system would work.  For the simulation I will use the actual results of games played through March 21 and simulated results of games not yet played (including conference tournament games).  This will produce simulated conference regular season standings, conference tournament results, and other conference game results that I will use to fill the team slots allocated to each conference.  The simulated results of games, of course, may turn out to be wrong, so I am doing this only to illustrate how the process will work.  (The simulated results will be right about 2/3 of the time.)  This results in the following 16 tentative seeds (not in seed order), which I am calling the Tier 1 teams:


The yellow highlighted teams are ones that either already are or that my simulation indicates will be conference automatic qualifiers.  These tentative teams for the 16 seed positions and those I identify as automatic qualifiers may change as actual results replace my simulated results.

In addition, while the above baseline is based on history so far as the conferences are concerned, it also ought to be consistent with history in terms of regional playing pools I described in my preceding article.  The following three tables are the same as the three conference tables above, but are for the regional playing pools:


As the last table shows, on average the highlighted (South and West) regions have had 15 or 16 seeds and the other regions (Middle and Northeast) have had 1 or none.  At a minimum the highlighted regions have had 14 seeds and at a maximum the other regions have had 2.  In other words, history indicates one should expect that the Committee’s Top 16 teams will come almost entirely from the South and West playing pools with perhaps 1 and a maximum of 2 coming from the Middle and Northeast pools.

Looking at the tentative Top 16 teams list above, 12 teams are from the South region and 4 from the West.  This is consistent with the above region tables.  The tables suggest that if I were to decide to revise the tentative team list in order to seed a team from the Middle or Northeast region (which would mean from the American, Big East, or Summit conference), it likely should replace one of the teams from the South region rather than from the West.

In my next article, I will discuss the additional steps needed to finalize the seeds and make the remaining at large selections.

NCAA TOURNAMENT: HOW IN THE WORLD IS THE COMMITTEE GOING TO MAKE AT LARGE SELECTIONS? PART 3 - THE REMAINING AT LARGE TEAMS

Step 2:  Once the tentative Top 16 are set, there will be additional at large positions to fill to get to 19.

Although we know the Committee’s Top 16 each year, the Committee does not tell us how it ranked the remaining at large teams in the bracket.  There is one set of decisions the Committee makes, however, that gives some insight into how it ranks teams: awards of first round home games.  While it may not always be true that the Committee gives home games to the teams it considers #17 through #32, for purposes of figuring out an appropriate baseline distribution of the additional at large selections among conferences and regions, treating the historic unseeded first round home teams as #17 through #32 is as good an approach as I can find.  

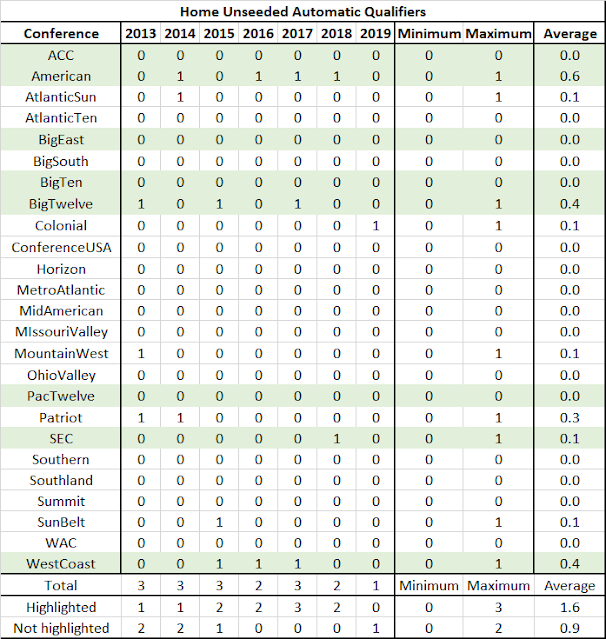
Using that approach, the following tables show the conference distribution of unseeded teams that have had home field advantage in the Tournament first round.  The first table is for automatic qualifiers, the second for at large teams, and the third for the two combined.


Of these three tables, the middle one for the unseeded home field at large teams is the most useful.  It shows that historically all of the unseeded home field at large teams have come from the highlighted conferences.

Building on the above conference tables and those from the Part 2 article, one final conference table shows the historic distribution among conferences of both seeded teams and unseeded home field teams (including both automatic qualifiers and at large teams):


(Note:  The numbers do not always come out to 32 teams per year due to the tables not including the Ivy League and the Big West.)

Based on this table, here are tentative numbers of teams for conferences, covering both seeds and additional teams in the Top 32 (rounding off the averages from the above table).  Plus I am including the historic maximum and minimum for each conference:

ACC:  7 teams as the tentative number, but with the possibility of the number ranging between 5 and 9

American: 2 teams as the tentative number, but with the possibility of the number ranging between 0 and 3

Atlantic Sun: 0 teams as the tentative number, but with the possibility of 1

Big East: 1 team as the tentative number, but with the possibility of the number ranging between 0 and 3

Big 10:  4 teams as the tentative number, but with the possibility of the number ranging between 1 and 8

Big 12:  4 teams as the tentative number, but with the possibility of the number ranging between 2 and 6

Colonial: 0 teams as the tentative number, but with the possibility of 1

Mountain West: 0 teams as the tentative number, but with the possibility of 1

Pac 12:  5 teams as the tentative number, but with the possibility of the number ranging between 3 and 7

Patriot: 0 teams as the tentative number, but with the possibility of 1

SEC:  5 teams as the tentative number, but with the possibility of the number ranging between 4 and 8

Summit: 0 teams as the tentative number, but with the possibility of 1

Sun Belt: 0 teams as the tentative number, but with the possibility of 1

West Coast:  2 teams as the tentative number, but with the possibility of the number ranging between 1 and 3

In the selection system I am describing, as a first step in its process of adding at large teams to those seeded, the Committee would use the above numbers to create lists of teams based on where they stand within their conferences.

In the preceding article, I described the method I am using for ranking teams within their conferences.  That method results in the following table of teams, based on the actual results of games played through March 21 and simulated of games not yet played (including conference tournaments).  The tentative seeded teams are Tier 1; the tentative teams ranked #17 through #32 are Tier 2; and the possible additional candidates based on the maximum each conference has had historically are Tier 3:


In the table, the yellow highlighted teams are conference automatic qualifiers or teams my simulation currently says will be automatic qualifiers.

With this list, I do a check to see that the distribution of teams among regional playing pools is appropriate.  The following table is similar to the last conference table above:


This table says that the list of seeds and unseeded candidates should include, on average, no Middle, 2 Northeast, 22 South and 7 West teams.  The above list, based on the last conferences table, includes these numbers for the South and West regions but has only 1 team from the Northeast.  Because of this, I can consider elevating a Northeast region team from Tier 3 to Tier 2.  This team would come from the Big East, Colonial, or Patriot conference.

With the list set, I first, starting with the Tier 1 teams, must decide on the actual 16 seeds.  To do this, I focus my attention on the Tier 1 teams’ actual game results as well as the game results of the Tier 2 teams.  My primary emphasis is on head-to-head results among the teams in these Tiers and especially very good head-to-head results, with perhaps secondary consideration of results of teams in these Tiers against common opponents and of poor results.

Once I have set the actual 16 seeds, there will be 14 (or 15) teams from Tiers 1 and 2 that did not get seeds.  This is likely to be more teams than there will be remaining at large positions to fill.  I again use actual game results to decide on a tentative list of teams from this group to fill the remaining at large positions, again with a primary emphasis on head-to-head results and especially very good head-to-head results and perhaps secondary consideration of results against common opponents and poor results.

With final decisions on seeds and tentative decisions on the remaining at large teams in place, I now look at the Tier 3 teams to see if any of them that are not automatic qualifiers should replace any of the tentative at large selections.  Again, I use actual game results to do this with an emphasis on head to head results and especially very good head-to-head results and perhaps with consideration of results against common opponents and poor results.

At the end of this process, I have completed the at large selections.  And, I have produced a credible group of participants for the NCAA Tournament.

NCAA TOURNAMENT: KEEPING THE RPI HONEST, PART 5

 In Parts 1 and 2 of this series, I described a test to see if this year’s RPI will be usable.  The test compares the Top 60 and Top 30 in the RPI rankings to baselines for the Top 60 and Top 30 derived from 2013 to the present.  It looks at two groups of conferences: a highlighted group consisting of the eight conferences that have had at least one team in the Top 60 every year since 2013 (ACC, American, Big East, Big 10, Big 12, Pac 12, SEC, West Coast) and a not-highlighted group consisting of all the other conferences.  The test shows the average number of teams and the high and low number of teams each group has had in the Top 60 and Top 30 since 2013.  It asks the question of how the numbers for the RPI ranks this year compare to the test period numbers.

Top 60 Test:  The RPI Top 60 should include roughly 49 teams from the highlighted conferences and 11 teams from the not-highlighted conferences.  The actual numbers can range on either side of these test numbers, but 45 teams should be the minimum from the highlighted group and 15 the maximum from the not-highlighted group.

Top 30 Test:  The RPI Top 30 should include roughly 28 teams from the highlighted conferences and 2 teams from the not-highlighted conferences.  The actual numbers can range on either side of these test numbers, but 27 teams should be the minimum from the highlighted group and 3 the maximum from the not-highlighted group.

Here are three different looks at how these tests apply to the current season.

 ACTUAL RPI, TO DATE

For games played through Sunday, March 21, the following table shows conference representation in the Top 60 and Top 30, plus totals for the highlighted and not-highlighted conferences at the bottom.  The left portion of the table is based on actual RPI ranks, to date, and the right portion of the table has the historic baseline test numbers.


The following table is similar but for regional playing pools:


ACTUAL RPI, TO DATE, CONFERENCES PLAYING SOME NON-CONFERENCE GAMES

Here are similar tables, but for this year’s Top 60 and Top 30 if I consider only conferences playing at least some non-conference games.  I include these tables because it is indisputable that for conferences that play no non-conference games, the RPI cannot rank their teams in relation to teams from other conferences.


SIMULATED RPI, USING ACTUAL RESULTS TO DATE

Here are similar tables, but based on the entire season, including conference tournaments.  Their underlying data are the actual results of games played through March 21 plus simulated results of future games.  These should give a pretty good picture of what the end-of-season numbers will look like.


Monday, March 15, 2021

NCAA TOURNAMENT: KEEPING THE RPI HONEST, PART 4

In Parts 1 and 2 of this series, I described a test to see if this year’s RPI will be usable.  The test compares the Top 60 and Top 30 in the RPI rankings to baselines for the Top 60 and Top 30 derived from 2013 to the present.  It looks at two groups of conferences: a highlighted group consisting of the eight conferences that have had at least one team in the Top 60 every year since 2013 (ACC, American, Big East, Big 10, Big 12, Pac 12, SEC, West Coast) and a not-highlighted group consisting of all the other conferences.  The test shows the average number of teams and the high and low number of teams each group has had in the Top 60 and Top 30 since 2013.  It asks the question of how the numbers for the RPI ranks this year compare to the test period numbers.

Top 60 Test:  The RPI Top 60 should include roughly 49 teams from the highlighted conferences and 11 teams from the not-highlighted conferences.  The actual numbers can range on either side of these test numbers, but 45 teams should be the minimum from the highlighted group and 15 the maximum from the not-highlighted group.

Top 30 Test:  The RPI Top 30 should include roughly 28 teams from the highlighted conferences and 2 teams from the not-highlighted conferences.  The actual numbers can range on either side of these test numbers, but 27 teams should be the minimum from the highlighted group and 3 the maximum from the not-highlighted group.

Before showing how the numbers so far this year compare to the test period numbers, here are some background data:

Numbers of Games Per Team:  In a normal regular season (including conference tournaments), teams average 10.2 conference games and 8.0 non-conference games for a total of 18.2 games.  This year, based on the schedule as of March 15, teams will average 9.2 conference and 2.7 non-conference games for a total of 11.9.  If I look only at teams from conferences that are playing both conference and non-conference games, the numbers are 9.7 and 2.7 for a total of 12.4.  It seems likely these numbers will decline some as games are lost due to Covid 19 restrictions and weather.  As a point of information, the NCAA has opined that the RPI would not work for FCS football, where teams play a maximum of 12 games.

Proportion of Non-Conference Games.  In a normal regular season, conference games are 56.0% and non-conference games 44.0% of games played.  This year, based on the schedule as of March 15, the numbers will be 83.2% and 16.8% overall and 78.5% and 21.5% if I look only at conferences playing both conference and non-conference games.

Proportion of Out-of-Region Games.  In a normal regular season, in-region games are 81.9% and out-of-region games are 18.1% of games played.  This year, based on the current schedule, the numbers will be 96.9% and 4.1% overall and 94.9% and 5.1% if I look only at conferences playing both conference and non-conference games.

I have covered numbers of games and proportions of non-conference and out-of-region games because they all affect the viability of the RPI at ranking teams within a single national system.

 ACTUAL RPI, TO DATE

For games played through Sunday, March 14, the following table shows conference representation in the Top 60 and Top 30, plus totals for the highlighted and not-highlighted conferences at the bottom.  The left portion of the table is based on actual RPI ranks, to date, and the right portion of the table has the historic baseline test numbers.


The following table is similar but for regional playing pools:


ACTUAL RPI, TO DATE, CONFERENCES PLAYING SOME NON-CONFERENCE GAMES

Here are similar tables, but for this year’s Top 60 and Top 30 if I consider only conferences playing at least some non-conference games.  I include these tables because it is indisputable that for conferences that play no non-conference games, the RPI cannot rank their teams in relation to teams from other conferences.


SIMULATED RPI, USING ACTUAL RESULTS TO DATE

Here are similar tables, but based on the entire season, including conference tournaments.  Their underlying data are the actual results of games played through March 14 plus simulated results of future games.  For the highlighted and not-highlighted groups, these should give a pretty accurate picture of what the end-of-season numbers will look like.


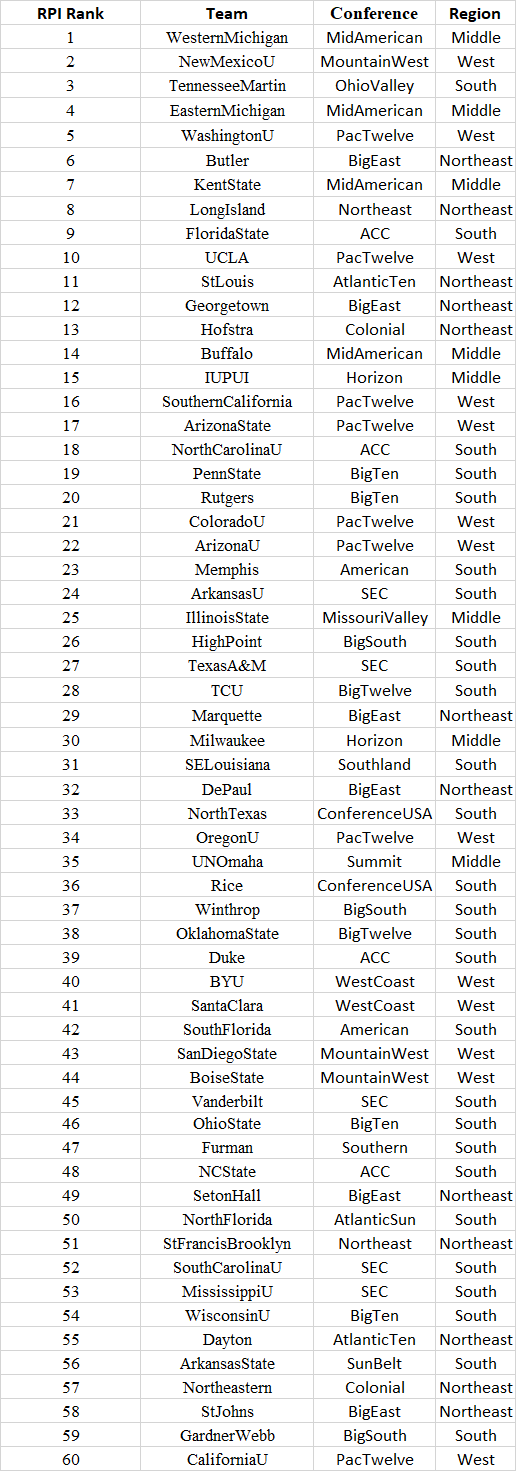
BONUS: ACTUAL RPI RANKINGS THROUGH MARCH 14 GAMES

As an added bonus, here are the RPI Top 60 based on games played through Sunday, March 14:


Monday, March 8, 2021

NCAA TOURNAMENT: KEEPING THE RPI HONEST, PART 3

 In the two preceding posts, I described a test to see if this year’s RPI will be usable.  The test compares the Top 60 and Top 30 in the RPI rankings to baselines for the Top 60 and Top 30 derived from 2013 to the present.  It looks at two groups of conferences: a highlighted group consisting of the eight conferences that have had at least one team in the Top 60 every year since 2013 (ACC, American, Big East, Big 10, Big 12, Pac 12, SEC, West Coast) and a not-highlighted group consisting of all the other conferences.  The test shows the average number of teams and the high and low number of teams each group has had in the Top 60 and Top 30 since 2013.  It asks the question of how the numbers for the RPI ranks this year compare to the test period numbers.

Top 60 Test:  The RPI Top 60 should include roughly 49 teams from the highlighted conferences and 11 teams from the not-highlighted conferences.  The actual numbers can range on either side of these test numbers, but 45 teams should be the minimum from the highlighted group and 15 the maximum from the not-highlighted group.

Top 30 Test:  The RPI Top 30 should include roughly 28 teams from the highlighted conferences and 2 teams from the not-highlighted conferences.  The actual numbers can range on either side of these test numbers, but 27 teams should be the minimum from the highlighted group and 3 the maximum from the not-highlighted group.

Before showing how the numbers so far this year compare to the test period numbers, here are some background data:

Numbers of Games Per Team:  In a normal regular season (including conference tournaments), teams average 10.2 conference games and 8.0 non-conference games for a total of 18.2 games.  This year, based on the current schedule, teams will average 9.3 conference and 2.7 non-conference games for a total of 11.9.  If I look only at teams from conferences that are playing both conference and non-conference games, the numbers are 9.8 and 2.7 for a total of 12.5.  It seems likely these numbers will decline some as games are lost due to Covid 19 restrictions and weather.  As a point of information, the NCAA has opined that the RPI would not work for FCS football, where teams play a maximum of 12 games.

Proportion of Non-Conference Games.  In a normal regular season, conference games are 56.0% and non-conference games 44.0% of games played.  This year, based on the current schedule, the numbers will be 83.3% and 16.7% overall and 78.5% and 21.5% if I look only at conferences playing both conference and non-conference games.

Proportion of Out-of-Region Games.  In a normal regular season, in-region games are 81.9% and out-of-region games are 18.1% of games played.  This year, based on the current schedule, the numbers will be 96.9% and 4.1% overall and 95.1% and 4.9% if I look only at conferences playing both conference and non-conference games.  (Teams in the West regional playing pool will play only 4 games outside their region.)

I have covered numbers of games and proportions of non-conference and out-of-region games because they all affect the viability of the RPI at ranking teams within a single national system.

 ACTUAL RPI, TO DATE

For games played through Sunday, March 7, the following table shows conference representation in the Top 60 and Top 30, plus totals for the highlighted and not-highlighted conferences at the bottom.  The left portion of the table is based on actual RPI ranks, to date, and the right portion of the table has the historic baseline test numbers.


The following table is similar but for regional playing pools:


ACTUAL RPI, TO DATE, CONFERENCES PLAYING SOME NON-CONFERENCE GAMES

Here are similar tables, but are for this year’s Top 60 and Top 30 if I consider only conferences playing at least some non-conference games.  I include these tables because it is indisputable that for conferences that play no non-conference games, the RPI cannot rank their teams in relation to teams from other conferences.


SIMULATED RPI, USING ACTUAL RESULTS TO DATE

Here are similar tables, but based on the entire season, including conference tournaments.  Their underlying data are the actual results of games played to date plus simulated results of future games.  For the highlighted and not-highlighted groups, these should give a pretty accurate picture of what the end-of-season numbers will look like.


BONUS: RPI RANKINGS THROUGH MARCH 7 GAMES

As an added bonus, here are the RPI Top 60 based on games played through Sunday, March 7: