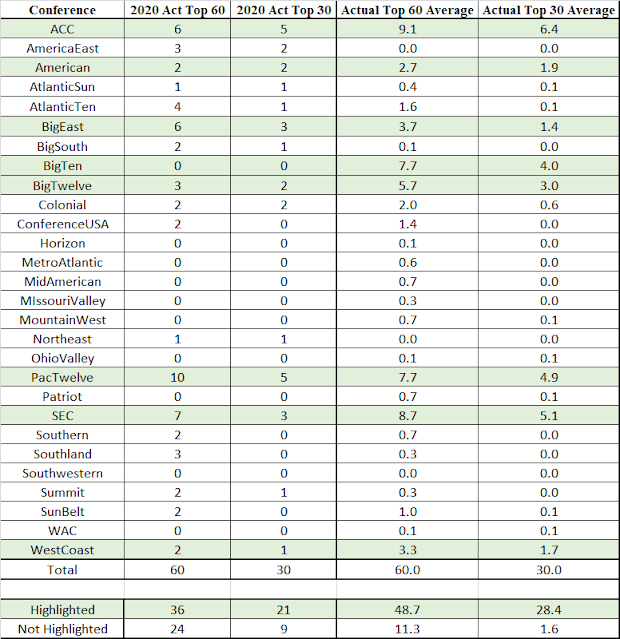
In Parts 1 and 2 of this series, I described a test to see if this year’s RPI will be usable. The test compares the Top 60 and Top 30 in the RPI rankings to baselines for the Top 60 and Top 30 derived from 2013 to the present. It looks at two groups of conferences: a highlighted group consisting of the eight conferences that have had at least one team in the Top 60 every year since 2013 (ACC, American, Big East, Big 10, Big 12, Pac 12, SEC, West Coast) and a not-highlighted group consisting of all the other conferences. The test shows the average number of teams and the high and low number of teams each group has had in the Top 60 and Top 30 since 2013. It asks the question of how the numbers for the RPI ranks this year compare to the test period numbers.
Top 60 Test: The RPI Top 60 should include roughly 49 teams from the highlighted conferences and 11 teams from the not-highlighted conferences. The actual numbers can range on either side of these test numbers, but 45 teams should be the minimum from the highlighted group and 15 the maximum from the not-highlighted group.
Top 30 Test: The RPI Top 30 should include roughly 28 teams from the highlighted conferences and 2 teams from the not-highlighted conferences. The actual numbers can range on either side of these test numbers, but 27 teams should be the minimum from the highlighted group and 3 the maximum from the not-highlighted group.
Before showing how the numbers so far this year compare to the test period numbers, here are some background data:
Numbers of Games Per Team: In a normal regular season (including conference tournaments), teams average 10.2 conference games and 8.0 non-conference games for a total of 18.2 games. This year, based on the schedule as of March 15, teams will average 9.2 conference and 2.7 non-conference games for a total of 11.9. If I look only at teams from conferences that are playing both conference and non-conference games, the numbers are 9.7 and 2.7 for a total of 12.4. It seems likely these numbers will decline some as games are lost due to Covid 19 restrictions and weather. As a point of information, the NCAA has opined that the RPI would not work for FCS football, where teams play a maximum of 12 games.
Proportion of Non-Conference Games. In a normal regular season, conference games are 56.0% and non-conference games 44.0% of games played. This year, based on the schedule as of March 15, the numbers will be 83.2% and 16.8% overall and 78.5% and 21.5% if I look only at conferences playing both conference and non-conference games.
Proportion of Out-of-Region Games. In a normal regular season, in-region games are 81.9% and out-of-region games are 18.1% of games played. This year, based on the current schedule, the numbers will be 96.9% and 4.1% overall and 94.9% and 5.1% if I look only at conferences playing both conference and non-conference games.
I have covered numbers of games and proportions of non-conference and out-of-region games because they all affect the viability of the RPI at ranking teams within a single national system.
ACTUAL RPI, TO DATE
For games played through Sunday, March 14, the following table shows conference representation in the Top 60 and Top 30, plus totals for the highlighted and not-highlighted conferences at the bottom. The left portion of the table is based on actual RPI ranks, to date, and the right portion of the table has the historic baseline test numbers.


No comments:
Post a Comment