This is my week eleven report for the 2023 season.
In the first table below, I show teams’ current RPI rankings, including showing teams in the history-based candidate groups as of this point in the season for NCAA Tournament #1 through #4 seeds and at large selections. (I do not show candidate groups for #6 through #8 seeds, as there is only one year of data for those groups, which I do not believe is enough precedent to establish reliable groups.) In addition, if you check the Team column, you will see some highlighted teams. These are teams outside the current RPI Top 57, but inside the Balanced RPI Top 57. Except for Washington State and Portland, which are in the current RPI candidate group for this week, they are teams that likely will not get at large selection consideration from the Committee due to its use of the current RPI even though, according to the Balanced RPI, they should get consideration.
In the other three tables, I show, using the actual results of games played through October 22 and simulated results for games not yet played (including simulated conference tournaments):
1. Teams’ simulated end-of-season ranks using the current NCAA RPI and my Balanced RPI;
2. Based on the current NCAA RPI, teams in candidate pools for NCAA Tournament #1, 2, 3, and 4 seeds and for at large selections and where they fit within the pools; and
3. Likely differences in at large selections for the NCAA Tournament if the Women’s Soccer Committee were to use the Balanced RPI rather than the current NCAA RPI.
The background for the information in the three tables is in 2023 Reports 1 through 4. NOTE: In determining the simulated results of games not yet played, I use teams' current NCAA RPI ratings based on games played through October 29.
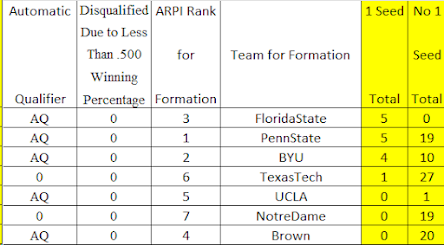
Summarizing the likely differences in at large selections for the NCAA Tournament in changing from the current NCAA RPI to the Balanced RPI, derived from the last table below:
At Large Candidate Teams: Eleven teams that are not at large candidates under the current NCAA RPI are candidates under the Balanced RPI. Of these, 1 is from the Middle, 0 from the North, 4 from the South, and 6 from the West regions. Nine are from Power 5 conferences and 2 are not. One of them, from the West and not from a Power 5 conference, is an Automatic Qualifier.
No Longer Candidate Teams: Eleven teams that are at large candidates (or Automatic Qualifiers) under the current NCAA RPI are not candidates under the Balanced RPI. Of these, 2 are from the Middle, 1 from the North, 7 from the South, and 1 from the West regions. None is from a Power 5 conference, 11 are not. Of the 11, 5 are Automatic Qualifiers.
Selected Teams: Five teams that either definitely (5 teams) or likely (0 teams) are not at large selections under the current NCAA RPI likely are at large selections under the Balanced RPI. Of these, 1 is from the Middle, 0 from the North, 1 from the South, and 3 from the West regions. Four are from Power 5 conferences and 1 is not.
No Longer Selected Teams: Five teams that likely are at large selections under the current NCAA RPI likely are not at large selections under the Balanced RPI. Of these, 1 is from the Middle, 2 from the North, 2 from the South, and 0 from the West regions. Two are from Power 5 conferences and 3 are not.
Current RPI Rankings
The first table below shows teams’ current RPI ranks, their strength of schedule contributor ranks, their opponents’ average RPI ranks, and their opponents’ average strength of schedule contributor ranks. These will help you see the differences between team RPI ranks and strength of schedule contributor ranks -- in an ideal rating system, those ranks should be the same, but under the current NCAA RPI they are not and often are not by a wide margin.
In addition, the table shows the same rank items for my Balanced RPI.
And, on the left, the table shows teams that are potential #1 through #4 seeds and at large selections, at this stage of the season, based on Committee decisions since 2007. The poorest ranked team in any candidate group is the poorest ranked team as of the current week that the Committee gave a positive decision to in its end of season decision process.
The second table shows average ranks for conferences, again allowing comparisons of average RPI ranks and average strength of schedule contributor ranks. The third table is similar, but is for geographic regions.


Simulated End-of-Season Ranks

Simulated NCAA Tournament Seed and At Large Selection Candidate Pools (based on current NCAA RPI)

#1 Seeds (showing Top 7 teams), most of which have significant negatives in their profiles, by historic standards:
#2 Seeds (showing Top 14 teams):

#3 Seeds (showing Top 23 teams):

#4 Seeds (showing Top 26 teams):

Simulated NCAA Tournament At Large Selections Using Current NCAA RPI As Compared To Balanced RPI


A few clarifying answers please: why 57 instead of 64? why does the at large bubble contain 35 teams and only go to 63? Is Duke automatically disqualified for being under .500? thanks
ReplyDeleteHistorically, the at large selections (of which there will be 33) always have come from the Top 57 teams in the end-of-season RPI rankings. So that is the number I use for my full season simulation.
DeleteThe at large bubble is based on the actual RPIs as of October 29, which do not include simulated results for games being played this week. October 29 is the completion of Week 11 of the season, and when looking at the ratings as of that point, the pool of potential at large teams is a little large than the 57 that will define the pool at the end of the season (Week 12). So as of the completion of Week 11, the poorest-ranked team historically to end up getting an at large selection has been #63. In addition, the teams that are outside the bubble group at the good end of the rankings always have gotten at large selections, so they are treated as sure things for at large positions, thus not bubble teams. This leaves 35 teams in the bubble.
You are correct that Duke is disqualified for being under .500. I think that is a bad rule, but it has been in place for a long time. As a practical matter, it has had little effect over the years because teams with records under .500 would not have gotten at large positions anyway. Duke could be an exception this year.
Thank you for replying. Have you looked at historical numbers of bids each conference has received? It would be interesting to see how things worked out for the higher/est seeds that lost in the non-Power conferences.
DeleteDuke would likely be a tougher opponent than a large number of AQs.
non-Power conference tournaments
DeleteCould you take another try at your question. I am not sure I understand it.
DeleteWhen lesser teams win non-conference titles in NCAA BB, the committee must choose between regular season winners and Power/mid-major non winners for the at-large spots. I'm just curious how that works out in women's soccer. A quick look at the '22, '21,'19, and '18 tourneys shows only 10,9,8,7 of the 31 conferences getting multiple bids in a year so there's must not be a lot of leeway given to those lesser conference regular season winners.
DeleteIf I understand your question:
DeleteThere are 31 conferences that have women's soccer. Each has a team that automatically qualifies for the NCAA Tournament. How the Automatic Qualifier is determined is up to the conference, but for 29 of the conferences it is the winner of the end-of-season conference tournament. For the Pac 12 and West Coast Conference, they do not have conference tournaments and it is the team that finishes first in the conference regular season standings.
That leaves 33 at large positions for the Women's Soccer Committee to fill, in order to fill out the 64-team Tournament bracket. The Committee is supposed to pick the 33 teams that have performed best over the course of the season based on a number of factors, one of which is the Rating Percentage Index (RPI), which is an NCAA-created rating system. Typically, most of the at large positions are filled with teams from Power 5 conferences. Other conferences that often get at large positions are the West Coast Conference, Big East, American Athletic Conference, and Ivy League. There are occasional at large teams from other conferences, but not very often.
Thanks. It'll be interesting to see how things work out this year.
Delete