This is my seventh weekly report for the 2023 season.
In the first table below, I show teams’ current RPI ratings, including showing teams in the history-based candidate groups as of this point in the season for NCAA Tournament #1 through #4 seeds and at large selections. In the other three tables, I show, using the actual results of games played through October 1 and simulated results for games not yet played (including simulated conference tournaments):
1. Teams’ simulated end-of-season ranks using the current NCAA RPI and my Balanced RPI;
2. Based on the current NCAA RPI, teams in candidate pools (expanded) for NCAA Tournament #1, 2, 3, and 4 seeds and for at large selections and where they fit within the pools; and
3. Likely differences in at large selections for the NCAA Tournament if the Women’s Soccer Committee were to use the Balanced RPI rather than the current NCAA RPI.
The background for the information in these three tables is in 2023 Reports 1 through 4.
Summarizing the likely differences in at large selections for the NCAA Tournament in changing from the current NCAA RPI to the Balanced RPI, derived from the last table below:
At Large Candidate Teams: Nine teams that are not at large candidates under the current NCAA RPI are candidates under the Balanced RPI. Of these, 2 are from the Middle, 1 from the North, 2 from the West, and 4 from the South regions. All 9 are from Power 5 conferences.
No Longer Candidate Teams: Nine teams that are at large candidates (or Automatic Qualifiers) under the current NCAA RPI are not candidates under the Balanced RPI. Of these, 2 are from the Middle, 2 from the North, 5 from the South, and 0 from the West regions. None is from a Power 5 conference. Of these, 5 are Automatic Qualifiers and the other 4 likely would not get at large selections under the current NCAA RPI.
Selected Teams: Five teams that either definitely or likely are not at large selections under the current NCAA RPI likely are at large selections under the Balanced RPI. Of these, 0 are from the Middle, 1 from the North, 1 from the South, and 3 from the West regions. Four are from Power 5 conferences and 1 is not.
No Longer Selected Teams: Five teams that likely are at large selections under the current NCAA RPI likely are not at large selections under the Balanced RPI. Of these, 1 is from the Middle, 2 from the North, and 2 from the South regions. 1 is from a Power 5 conference and 4 are not.
The basic change pattern is that teams dropped from the at large candidate pool mostly either are Automatic Qualifiers or likely are not at large selections under the current RPI, so they are not hurt by a change to the Balanced RPI. But of the teams added to the candidate pool under the Balanced RPI, some likely are at large selections, displacing teams that are at large selections under the current NCAA RPI. Thus the effect of the defects in the current NCAA RPI is to prevent teams that deserve at large selections from even being considered by the Committee, with the result that less deserving teams are getting at large selections.
Current RPI Rankings
The first table below shows teams’ current RPI ranks, their strength of schedule contributor ranks, their opponents’ average RPI ranks, and their opponents’ average strength of schedule contributor ranks. These will help you see the differences between team RPI ranks and strength of schedule contributor ranks -- in an ideal rating system, those ranks should be the same. In addition, the table shows the same rank items for my Balanced RPI. And, on the left, the table shows teams that are potential #1 through #4 seeds and at large selections, at this stage of the season, based on Committee decisions since 2007. The poorest ranked team in any candidate group is the poorest ranked team as of the current week that the Committee gave a positive decision to in its end of season decision process.
The second table shows average ranks for conferences, again allowing comparisons of average RPI ranks and average strength of schedule contributor ranks. The third table is similar, but is for geographic regions.
NOTE: The NCAA published RPI ranks and ratings for games through October 1 include one item of erroneous data. They include a September 28 erroneous result of the game between FGCU and Kennesaw State as a 1-1 tie rather than the actual result of a 3-1 win by FGCU. Thus the currently published NCAA ratings and ranks are slightly different than mine. I have advised the coaches of the error, so hopefully the NCAA will have the correct data by its next publication date.


Simulated End-of-Season Ranks


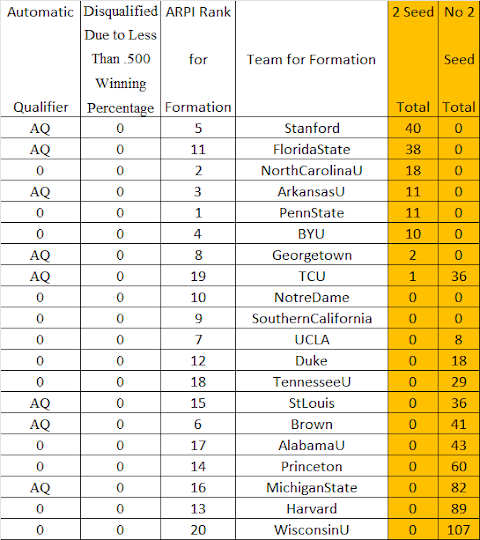
#2 Seeds (showing top 20 teams):
#3 Seeds (showing Top 30 teams):

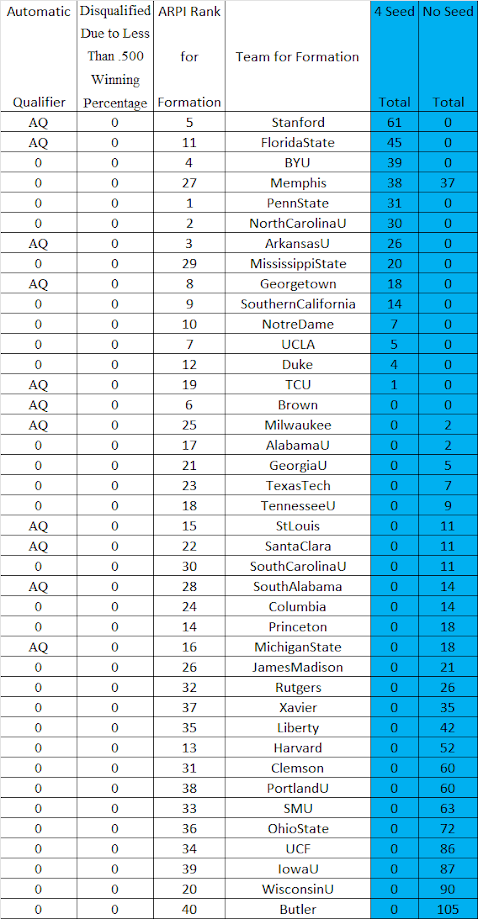
#4 Seeds (showing Top 40 teams):


No comments:
Post a Comment