There are two big questions for the Women’s Soccer Committee this Spring:
1. Will we be able to use the RPI as a tool when forming the NCAA Tournament bracket? If so, how useful will it be?
2. If we can’t use the RPI or if its usefulness is limited, how will we form the bracket?
In my November 27, 2020 article, I used the RPI rankings during the Fall season to show how the RPI works. For the RPI this year, there are three areas of concern: the reduced number of games teams will be playing, the reduced proportion of non-conference games, and the reduced proportion of out-of-region games. And in my December 26, 2020 article, I discussed potential non-RPI based tools for forming the bracket. These two topics will be a main focus for me over the coming weeks.
According to the Pre-Championship Manual, the NCAA will do RPI calculations for the 2020-21 season. It will issue its first RPI reports the week of March 1 and will issue reports weekly thereafter. The purpose of these reports this year mainly may be to produce the Team Sheets that the Committee uses as a tool during bracket formation. The Team Sheets contain detailed information about each team’s record, above and beyond RPI-related information. The planned issuance of RPI reports suggests, however, that the NCAA and the Committee may not have decided yet whether the RPI ratings and ranks themselves will be a usable bracket formation tool.
To help see whether the RPI will be usable, I created two tests to apply to the RPI rankings as the NCAA issues them weekly. I will explain the tests in this post (Part 1). In the next post (Part 2), I will will apply the tests to simulated end-of-season rankings I have done. You will be able to use your own judgment as to whether it is likely the RPI will be usable.
For a basic data resource, the tests use the end-of-season RPI rankings for the years 2013 to the present. (2013 is the year of completion of the most recent major conference membership re-alignment.) For each year, the first test’s data are the rankings and conferences of the Top 60 teams. The second test’s data are the same but limited to the Top 30 teams. I use the Top 60 because all Tournament at large teams since 2007 have come from the Top 57, and the Top 60 is a nice rounded off number. I use the Top 30 because since 2007, all RPI Top 30 teams have gotten at large selections.
Top 60 Test
Below are three tables. I will explain below each one.
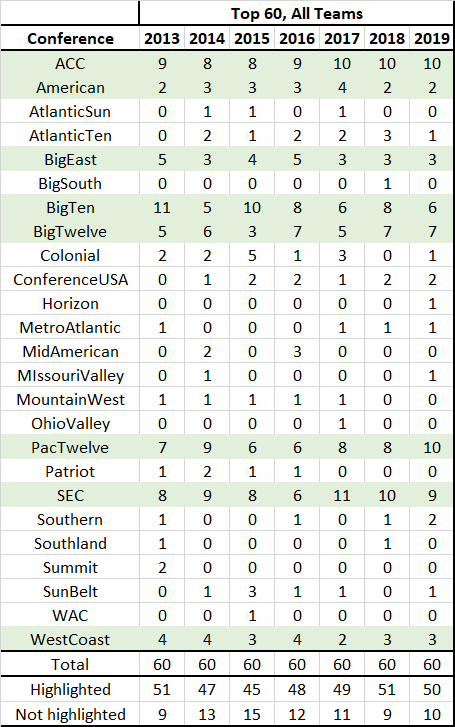


Using these numbers as a test for the reasonability of the RPI this year, we reasonably can expect that the RPI Top 60 will include roughly 49 teams from the highlighted conferences and 11 teams from the not-highlighted conferences. Further, using the minimum and maximum numbers from the bottom of the first table, we can expect that 45 teams will be the minimum we should see from the highlighted group and 15 the maximum from the not-highlighted group.
Top 30 Test
The following three tables are the same as the above three, except are based on the Top 30 in the RPI rankings.


1. Are too many teams from the not-highlighted conferences showing up in the Top 30 and Top 60?
2. Are the distributions of the teams among the highlighted conferences reasonably consistent with the averages those conferences have had since 2013?
No comments:
Post a Comment