Effect of the No Overtime and RPI Formula Changes on How the RPI Functions as a Rating System
The next set of information shows how the No Overtime and 2024 RPI Formula changes will affect the RPI as a rating system: Will they make it better or worse or will they have little effect?
The above table, and the ones that follow, compare how different versions of the RPI perform as rating systems. In the above table, the first row shows how the NCAA
Unadjusted RPI, as in effect in 2023, performs. The second row is for the NCAA
Adjusted RPI as in effect in 2023. These first two rows use as their data base games played from 2010 through 2021 (about 30,000 games), to show how the systems performed when there were overtime games.
The third row likewise is for the NCAA Adjusted RPI as in effect in 2023, but with games played from 2010 through 2023 as the data base and with all overtime games treated as ties. By comparing this row to the one above it, you can see the effect of the No Overtime rule.
The fourth and fifth rows are for the NCAA Unadjusted and Adjusted RPI with the 2024 formula changes, with 2010 through 2023 as the data base and with all overtime games treated as ties.
Finally, the sixth row is for my Balanced RPI, with 2010 through 2023 as the data base and with all overtime games treated as ties. I have included the Balanced RPI to show what can be achieved using the NCAA RPI's architecture as a base but with multiple additional calculations.
The above table shows simply the percentages of games that the higher rated teams (after adjustment for home field advantage) won, lost, and tied for each system. Since the bottom four systems are based on no overtime games and therefore fewer ties, the best comparison column is the Overall % Correct Disregarding Ties column. This column looks only at games that were won or lost and shows the percentage of games that the better rated team won.
The most significant information in that column is that with the change to the the No Overtime rule, the RPI became a significantly more accurate measure of teams' performance - -- the increase in accuracy from 81.0% with overtimes to 82,8% with no overtimes is a quite large improvement as rating systems go. This improvement is not surprising. With overtimes, about 20% of games when to overtime with about half of those games (~10% of all games) decided by golden goals. When the NCAA formula considered the golden goal games, it treated them just the same as other win-loss games, thus not recognizing that the two teams' performances were very close to equal. With overtimes eliminated, the formula now treats the performances as equal, which is a much better measure of the teams' performances than the old win-loss treatment.

This table is similar to the preceding one, but is limited to games involving at least one Top 60 team -- in other words, is related more or less to teams competing for NCAA Tournament at large positions. It is notable that again, the RPI performs significantly better with no overtimes.
It also is worth noting that under both of the above tables, with the changes to the 2024 formula, the RPI's performance is slightly poorer than under the pre-2024 formula.
The next tables and charts address how the RPI systems do at rating teams from conferences and regions in relation to teams from other conferences and regions and individual teams in relation to other individual teams.
The tables and charts are based on game result probabilities, which in turn, for each rating system, are based on a result probability table unique to that rating system. A result probability table comes from an analysis of all games played since 2010 and is very accurate, as the following table for the 2024 RPI Formula under a No Overtime rule shows:
On the left are the probable results for teams that are higher rated after adjustments for home field advantage, with the probable results derived using the applicable result probability table. On the right are actual results. As you can see, over a large number of game there is almost an exact match.
Looking at how a conference's teams do in non-conference games, if the rating system properly rates the conference's teams in relation to teams from other conferences, then the conference's win-tie-loss likelihoods in those games will match the actual results. As the following table for the 2024 RPI Formula under a No Overtime Rule shows, however, that is not the case for this rating system. Scroll to the right to see the entire table.
In the table, the three key columns are on the right. They show, for a conference, its actual winning percentage, its likely winning percentage using the result probability table, and the difference between the two. For example, using the ACC at the top, its actual winning percentage is 71.8%, its likely winning percentage based on its teams' and their opponents' ratings is 67.1%, and the difference is 4.7%. Remember, if a rating system were properly rating the ACC in relation to the other conferences, one would expect the two winning percentages to be the same and the difference to be 0%. What this means, for the ACC, is that it outperforms its ratings, in other words is underrated, with a 4.7% over-performance being a measure of the extent of the underrating.
By looking at each conference in this way, you can see which conferences the rating system underrates and which it overrates. In addition, you can see which conference is most underrated, which is most overrated, and the difference between the two. Thus looking at the above table, the most underrated conference is the ACC at 4.7% and the most overrated is SWAC at -7.4%, with a spread between the two of 12.2% (4.7% + 7.4%, rounded off). And, looking at all the conferences, you can see the extent by which all of them as a group differ from the ideal 0% difference between their actual performance and their likely performance, in this case a total difference of 64.6%. These numbers give you measures of the rating system's fairness when it comes to rating conferences' teams in relation to teams from other conferences. And, when going through this process for multiple rating systems, it allows you to compare them in terms of how the do at rating conferences in relation to other conferences. For the six rating systems covered by this report, this produces the following table:
The table shows an improvement in the RPI's fairness in relation to conferences when moving to the No Overtime rule. Then, in the 2024 change to a 1/3 weight for ties when computing Winning Percentage, there is a slight degradation. The addition of the 2024 bonus and penalty regime slightly reduces the degradation. As a whole, the table shows that all of the NCAA RPI systems have a conference fairness problem
The next table shows each conference's average rating and the difference between the conference's actual winning percentage and its likely winning percentage using the applicable result probability table. In addition, it has the teams arranged in order of their average RPI ratings.
The following chart is based on the data in the above table:

In the chart, the upper orange line (actually a series of data points) shows the conferences' average ratings, which are arranged in order from the best average rating on the left to the poorest on the right. The lower black data points are for the differences between the conferences' actual winning percentages and their likely winning percentages. The black data points are in the places where they fit in the rating spectrum from the highest rating on the left to the lowest rating on the right. The black straight line is a computer generated trend line that shows how the conferences' actual versus likely performance differences change as the conferences' average ratings descend. A simple look at the chart says that for conferences with higher average ratings, their actual results tend to be better than their ratings say they should be and for conferences with lower average ratings, their actual results tend to be poorer than their ratings say they should be. In other words, the rating system discriminates against stronger conferences and in favor of weaker conferences.
Above the black line is a formula. This is a formula that describes the black trend line and allows a computation of the extent of the ratings' discrimination. In the formula, x represents the different data points associated with the trend line. For the data at the extreme left, where the strongest conference is, x=1. For the data at the extreme right, where the weakest conference is, x=213. Thus by using the formula with x=1, one can calculate the actual v likely performance difference at the high point on the trend line at the left, and by using the formula with x=213, one can calculate the difference at the low point on the trend line at the right. The spread between these two differences is the extent to which the rating system discriminates against strong conferences and in favor of weak conferences. In the case of the above chart for the 2024 RPI Formula with No Overtimes, the computations produce an overperformance on the left of 4.3% and an underperformance on the right of -6.3%, for a spread between the two of 10.6%.
By going through the processes just described for multiple rating systems, it is possible to compare how they do in rating teams from conferences in relation to conference strength. The following table shows how the six rating systems covered in this report compare:
As this table shows, the No Overtime rule slightly improved the RPI in relation to conference strength. The change in tie weight to 1/3 had a small mixed effect, and the 2024 bonus and penalty regime likewise had a small mixed effect. As a whole, all of the NCAA RPI formulas have a problem fairly rating the conferences in relation to each other and all discriminate in relation to conference strength.
The next table is the general fairness table but for teams categorized by four geographic regions within which teams are located: Middle, North, South, and West:
As the table shows, the NCAA RPI versions all have a general fairness problem in relation to regions. Again the change to No Overtime resulted in an improvement. For regions, the 2024 RPI Formula slightly degrades the No Overtime performance from what it was under the pre-2024 Formula.
This table comes from trend charts for regions, looking at performance in relation to the regions' average ratings. Here, the full NCAA 2024 Formula is a slight improvement over the full 2023 Formula, with the 2024 bonus and penalty regime being responsible for the improvement. For all of the NCAA RPI systems, however, there is a problem of discrimination in relation to region strength..
For regions, I use an additional metric, which is performance in relation to the percentage of the regions' games that are ties. I use this metric because the regions have different levels of parity and the percentage of games that are ties is a surrogate for parity -- the higher the percentage of games that are ties, the more likely there is greater parity within the region. At the RPI for Division I Women's Soccer website, on the
RPI: Regional Issues page, I discuss a problem the NCAA RPI has, which is rating teams from regions fairly in relation to each other if the regions have different levels of parity. There, I show that the West region has a higher level of parity than the other regions, followed by the Middle and North regions, with the South having the least parity. The following chart is like the one above for conferences, but is for regions and relates regions' performance to their percentages of ties:
The following comparison table comes from charts like this for the six rating systems covered by this report:
As the table shows, unlike for the other metrics above, the change to No Overtimes had a negative impact on how the RPI functions, increasing discrimination among regions in relation to intra-region parity. Further, the change in tie valuation to 1/3 has increased the discrimination even more. Both of these effects are as expected, since regions with a higher proportion if ties -- those with more parity -- will suffer more devaluations of their Winning Percentages than regions with lower parity and fewer ties. As a whole, all of the NCAA RPI systems have a discrimination problem in relation to intra-region parity: they underrate teams from regions with high parity and overrate teams from regions with low parity.
Looking at individual teams produces the following table:
The table again shows an improvement in fairness with the change to No Overtimes, but some degradation in the change to the 2024 Formula.
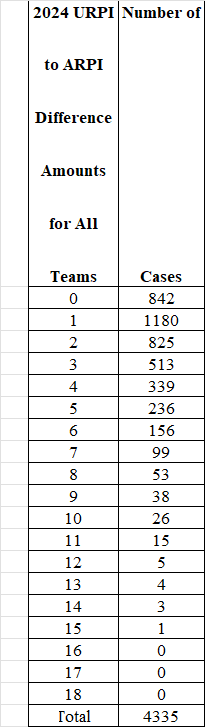
The last table, below, addresses a different issue. Because of the way the NCAA RPI calculates strength of schedule, teams' NCAA RPI ranks can be quite different than their ranks as RPI Strength of Schedule contributors to their opponents. This makes it possible for coaches to "trick" or "game" the RPI by scheduling with a view to opponents' likely Strength of Schedule contributor ranks rather than their likely RPI ranks. It is one of the reasons basketball stopped using the RPI.

This table shows that the various changes to the RPI over time have slightly degraded the RPI in relation to this problem: They have slightly increased the differences between teams' RPI ratings and their ratings as RPI Strength of Schedule contributors. In the table, towards the right, I have blue highlighted the column for Rank v SoS Rank Difference Percent 15 of Fewer Positions, which shows the percentage of teams for which the difference between their RPI rank and their rank as RPI Strength of Schedule contributors is 15 or fewer positions. I have highlighted this column because, based on my experience assisting coaches with scheduling, there is enough year-to-year variability that when teams' ordinary difference is 15 or fewer positions, it may not be worthwhile to consider that difference as significant for purposes of selecting good future opponents. As that column shows, for all of the NCAA RPI versions, about 1/3 of teams are in the 15 or fewer group, which leaves 2/3 in the group where it is worthwhile for coaches to consider their likely Strength of Schedule contributions during scheduling so as to artificially maximize their RPIs. As this column shows, where the higher the percentage the better the system, the bonus and penalty regimes, in particular, degrade the RPI, with the 2024 Formula performing the worst of all the NCAA RPI systems. The differences among the NCAA RPI systems, however, are relatively small.
Summary as to Effects of Changes on How the NCAA RPI Functions as a Rating System
Looking at the cumulative effects of the No Overtime rule and the 2024 Formula changes as compared to a 2023 Unadjusted RPI formula baseline, they are relatively small. The changes, however, make the RPI more discriminatory against regions with higher parity and in favor of regions with lower parity. And, they make the RPI slightly more able to be "tricked."
Conclusion
Of the changes over the past few years, the change to No Overtimes has a significant effect on NCAA Tournament at large selections. The 2024 change of tie weights to 1/3 for RPI Winning Percentage purposes has a small effect. The change to the 2024 bonus and penalty regime has a very small effect. The cumulative effect of the changes is significant.
In terms of how the RPI functions as a rating system, it functions better under the No Overtime rule with two exceptions: it is more discriminatory against regions with higher parity and it makes the system very slightly more susceptible to being "tricked" through smart scheduling. The 2024 Formula change effects are mixed and small.