[NOTE: Since initially publishing this article, I have refined the method for computing the relationship between conferences' and regions' ratings (and regions' percentage of tie games) and their actual performance as compared to expected performance. The article's charts and related tables now are based on the refined method rather than the previous cruder method.]
In 2022, an NCAA rule change did away with overtime games during the regular season, except for conference tournaments. This year, the NCAA, as proposed by the Women's Soccer Committee, has changed the RPI formula for Division I women's soccer. The purpose of this article is to show the effects of these changes in relation to (1) NCAA Tournament at large selections and (2) how the RPI functions as a rating system.
The 2024 RPI Formula Changes
There are two basic changes to the RPI formula:
1. The RPI formula for a team's Winning Percentage has been changed from
(Wins + 1/2 Ties)/(Wins + Losses +Ties)
to
(Wins + 1/3 Ties)/(Wins + Losses + Ties)
Notes:
(a) Winning Percentage account's for 50% of the RPI rating's effective weight. Strength of Schedule, made up of Opponent' Winning Percentage and Opponents' Opponents' Winning Percentage, accounts for the other 50%. In computing Strength of Schedule, the previous valuation of ties at 1/2 remains unchanged.
(b) The NCAA requires that a team have an overall won-lost record of at least 0.500 to be eligible for an at large position in the NCAA Tournament. If ties are part of the won-lost computation, the previous valuation of ties at 1/2 likewise remains unchanged.
2. The bonus and penalty regime, which applies adjustments to the RPI for good wins and ties and poor losses and ties, has changed. The old regime had high bonuses for wins and ties against teams with Unadjusted RPI ranks from #1 to 40 and lower bonuses for wins and ties against teams ranked #41 to 80. It had low penalties for losses and ties against the second-to-bottom 40 teams in the rankings and higher penalties for losses and ties against the bottom 40. In the new regime, there are three bonus tiers: #1 to 25, #26 to 50, and #51 to 100. There are bonuses for wins and ties in the first two tiers, but only for wins in the #51 to 100 tier. The penalty tiers are #151 through 250 for the lower penalties and #251 and poorer for the higher penalties.
The bonus and penalty amounts are as follows:
Tier 1, bonuses for wins and ties v opponents ranked #1 to 25:
Wins:
Away 0.0032, Neutral 0.0030, Home 0.0028
Ties:
Away 0.0020, Neutral 0.0018, Home 0.0016
Tier 2, bonuses for wins and ties v opponents ranked #26 to 50:
Wins:
Away 0.0026, Neutral 0.0024, Home 0.0022
Ties:
Away 0.0014, Neutral 0.0012, Home 0.0010
Tier 3, bonuses for wins v opponents ranked #51 to 100:
Wins:
Away 0.0008, Neutral 0.0006, Home 0.0004
Tier 4, penalties for losses and ties v opponents ranked #151 to 250:
Ties:
Away -0.0004, Neutral -0.0006, Home -0.0008
Losses:
Away -0.0010, Neutral -0.0012, Home -0.0014
Tier 5, penalties for losses and ties v opponents ranked #251 and poorer:
Ties:
Away -0.0016, Neutral -0.0018, Home -0.0020
Losses:
Away -0.0022, Neutral -0.0024, Home -0.0026
Ranking Effect of the 2024 Bonus and Penalty Regime
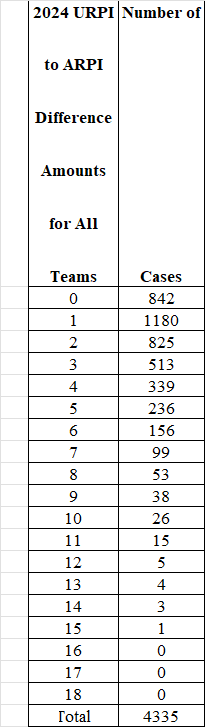
The following tables show the difference between the 2024 Formula's Unadjusted RPI ranks and the Adjusted RPI ranks under the new bonus and penalty regime. The first table covers all teams.


These tables compare teams' Unadjusted RPI ranks to their Adjusted RPI ranks and thus are indicators of how much the bonus and penalty regime affects the rankings. The tables -- especially the one for the Top 57 -- show that the bonuses and penalties have little effect on teams' rankings. This particularly is noteworthy since small ranking differences within rating systems such as the RPI (or any other accepted sport rating system) are relatively meaningless.

Effect of the No Overtime and RPI Formula Changes on NCAA Tournament At Large Selections
The changes altogether will have a significant cumulative effect on NCAA Tournament at large selections.
In reaching this conclusion, I started with a basic assumption:
The candidates for at large selections will be the teams ranked #1 through #57 in the Adjusted RPI rankings.
This assumption reflects what historically has been the case: Since 2007, all at large selections have come from teams ranked #1 through #57 by the Adjusted RPI. Although this could change, a change seems unlikely, so this assumption provides a good base for analyzing the effect of the no overtime and RPI formula changes.
The following table shows basic data on the effects of the changes on at large selections. The table contains the source data for the summary tables that follow. You can scroll to the right to see the entire table.
The table is based on the seasons from 2010 through 2023, excluding Covid-affected 2020. The 2024 Formula URPI and ARPI columns are based on applying the 2022 No Overtime rule and the 2024 RPI Formula changes to the data for each season. The Actual ARPI column is based on applying to each season the overtime rule and RPI formula in effect for that season. The No OT [Overtime] column is based on applying the current no overtime rule to each season, but using the RPI formula in effect for that season. Together, these columns allow a determination of the effect of each change on at large selections -- the change to no overtimes, the change to a 1/3 weight for ties in determining winning percentage, and the change in the bonus and penalty regime.

The following table summarizes the information in the above table. Remember, the numbers are spread over the 13 seasons from 2010 through 2023.

The first three data columns show the numbers of teams that have been brought into the Adjusted RPI Top 57 and thus become candidates for NCAA Tournament at large positions. As you can see, the No Overtime rule has the greatest effect on this, bringing 32 teams into the Top 57. Next comes the change to a 1/3 weight for ties, bringing in 8 teams. Last comes the new bonus and penalty regime, bringing in only 2 teams. Since the data cover 13 years, this means the changes will bring an average of just above 3 new teams per year into the at large candidate pool. As the fifth column indicates, one team entering the Top 57 is due to it having had a below 0.500 winning percentage under the actual rules in effect for it but an above 0.500 record if the no overtime rule were in effect.
Of the new teams brought into the at large candidate pool, it is not possible to know whether they would have received at large positions.
Next are three Actual At Large, No Longer ... columns. These show teams that actually received at large positions but that would not have received them under the new rules, due to their having dropped out of the Top 57 candidate pool. Of these, 16 dropped out due to the no overtime rule, 6 due to the change in tie weight to 1/3, and 1 due to the new bonus and penalty regime. Altogether this is just under 2 teams per year that received at large positions but that would not receive them under the No Overtime rule and the 2024 RPI Formula.
Following these are three Not Actual At Large, No Longer ... columns. These show teams that were Top 57 candidates for at large positions but that did not get them. Of these, 24 dropped out of the Top 57 candidate group due to the no overtime rule, 4 due to the change in tie weight to 1/3, and 0 due to the new bonus and penalty regime.
Of the teams dropping out of consideration for at large positions, the fourth column shows that 9 of them went from having winning percentages of 0.500 or better under the actual rules in effect for them to having a below 0.500 record if the No Overtime rule were in effect.
(Note: The number of teams moving into the Top 57 and out of the Top 57 do not match, as some teams moving in and out were Automatic Qualifiers, which are not included in the summary numbers.)
As these numbers show, the No Overtime rule has a significant effect on at large selections. The change in tie weight to 1/3 has a small effect. The new bonus and penalty regime has very little effect.

The above table, and the ones that follow, compare how different versions of the RPI perform as rating systems. In the above table, the first row shows how the NCAA Unadjusted RPI, as in effect in 2023, performs. The second row is for the NCAA Adjusted RPI as in effect in 2023. These first two rows use as their data base games played from 2010 through 2021 (about 30,000 games), to show how the systems performed when there were overtime games.

This table is similar to the preceding one, but is limited to games involving at least one Top 60 team -- in other words, is related more or less to teams competing for NCAA Tournament at large positions. It is notable that again, the RPI performs significantly better with no overtimes.

On the left are the probable results for teams that are higher rated after adjustments for home field advantage, with the probable results derived using the applicable result probability table. On the right are actual results. As you can see, over a large number of game there is almost an exact match.

In the table, the three key columns are on the right. They show, for a conference, its actual winning percentage, its likely winning percentage using the result probability table, and the difference between the two. For example, using the ACC at the top, its actual winning percentage is 71.8%, its likely winning percentage based on its teams' and their opponents' ratings is 67.1%, and the difference is 4.7%. Remember, if a rating system were properly rating the ACC in relation to the other conferences, one would expect the two winning percentages to be the same and the difference to be 0%. What this means, for the ACC, is that it outperforms its ratings, in other words is underrated, with a 4.7% over-performance being a measure of the extent of the underrating.

The table shows an improvement in the RPI's fairness in relation to conferences when moving to the No Overtime rule. Then, in the 2024 change to a 1/3 weight for ties when computing Winning Percentage, there is a slight degradation. The addition of the 2024 bonus and penalty regime slightly reduces the degradation. As a whole, the table shows that all of the NCAA RPI systems have a conference fairness problem
The next table shows each conference's average rating and the difference between the conference's actual winning percentage and its likely winning percentage using the applicable result probability table. In addition, it has the teams arranged in order of their average RPI ratings.

The following chart is based on the data in the above table:

In the chart, the upper orange line (actually a series of data points) shows the conferences' average ratings, which are arranged in order from the best average rating on the left to the poorest on the right. The lower black data points are for the differences between the conferences' actual winning percentages and their likely winning percentages. The black data points are in the places where they fit in the rating spectrum from the highest rating on the left to the lowest rating on the right. The black straight line is a computer generated trend line that shows how the conferences' actual versus likely performance differences change as the conferences' average ratings descend. A simple look at the chart says that for conferences with higher average ratings, their actual results tend to be better than their ratings say they should be and for conferences with lower average ratings, their actual results tend to be poorer than their ratings say they should be. In other words, the rating system discriminates against stronger conferences and in favor of weaker conferences.

As this table shows, the No Overtime rule slightly improved the RPI in relation to conference strength. The change in tie weight to 1/3 had a small mixed effect, and the 2024 bonus and penalty regime likewise had a small mixed effect. As a whole, all of the NCAA RPI formulas have a problem fairly rating the conferences in relation to each other and all discriminate in relation to conference strength.

As the table shows, the NCAA RPI versions all have a general fairness problem in relation to regions. Again the change to No Overtime resulted in an improvement. For regions, the 2024 RPI Formula slightly degrades the No Overtime performance from what it was under the pre-2024 Formula.


As the table shows, unlike for the other metrics above, the change to No Overtimes had a negative impact on how the RPI functions, increasing discrimination among regions in relation to intra-region parity. Further, the change in tie valuation to 1/3 has increased the discrimination even more. Both of these effects are as expected, since regions with a higher proportion if ties -- those with more parity -- will suffer more devaluations of their Winning Percentages than regions with lower parity and fewer ties. As a whole, all of the NCAA RPI systems have a discrimination problem in relation to intra-region parity: they underrate teams from regions with high parity and overrate teams from regions with low parity.


This table shows that the various changes to the RPI over time have slightly degraded the RPI in relation to this problem: They have slightly increased the differences between teams' RPI ratings and their ratings as RPI Strength of Schedule contributors. In the table, towards the right, I have blue highlighted the column for Rank v SoS Rank Difference Percent 15 of Fewer Positions, which shows the percentage of teams for which the difference between their RPI rank and their rank as RPI Strength of Schedule contributors is 15 or fewer positions. I have highlighted this column because, based on my experience assisting coaches with scheduling, there is enough year-to-year variability that when teams' ordinary difference is 15 or fewer positions, it may not be worthwhile to consider that difference as significant for purposes of selecting good future opponents. As that column shows, for all of the NCAA RPI versions, about 1/3 of teams are in the 15 or fewer group, which leaves 2/3 in the group where it is worthwhile for coaches to consider their likely Strength of Schedule contributions during scheduling so as to artificially maximize their RPIs. As this column shows, where the higher the percentage the better the system, the bonus and penalty regimes, in particular, degrade the RPI, with the 2024 Formula performing the worst of all the NCAA RPI systems. The differences among the NCAA RPI systems, however, are relatively small.
No comments:
Post a Comment