Tuesday, September 10, 2024

2024 ARTICLE 5: POST-WEEK-4 UPDATED PREDICTIONS

This week's predictions are based on the actual results of games played through Sunday, September 8, and win-loss-tie likelihoods of games not yet played.  The predictions assume the change from counting a tie as half a win to one-third of a win will be in effect this year.  They do not, however, include any effects of a changed RPI bonus and penalty system, since we do not yet know what the bonus and penalty amounts will be.  Assuming a change in the bonus and penalty structure also will go into effect this year, I should be able to determine the bonus and penalty amounts next week, once the NCAA has published teams' actual ratings at the RPI Archive.  At that point, I will incorporate the new bonus and penalty amounts into my system.

Team RPI and Balanced RPI Ranks, Plus RPI and Balanced RPI Strength of Schedule Contributor Ranks


Conference NCAA RPI and Balanced RPI Ranks, and Conference NCAA RPI Strength of Schedule Contributor Ranks

This week, for an educational tidbit, take a look at the conferences in the West region: Big Sky, Big West, Mountain West, and West Coast.  (The Summit and WAC have some teams from the West but also teams from other regions.)  You will see that for every one of those conferences, its Balanced RPI rank is better than its NCAA RPI rank, in some cases a lot better.  If you look at those conferences' NCAA RPI Strength of Schedule Contributor ranks and compare them to their NCAA RPI ranks, you will see that for three of those conferences, their Strength of Schedule Contributor ranks are poorer than their RPI ranks.  For a good rating system, those two ranks would not be different, but they are different for the NCAA RPI because of its defective method of calculating strength of schedule.  The Balanced RPI does not have this problem.

When you consider that the West conferences play the great majority of their games against opponents from the West, you can see why the NCAA RPI ranks them more poorly than the Balanced RPI:  The NCAA RPI underrates their strengths of schedule whereas the Balanced RPI does not.


Predicted NCAA Tournament Automatic Qualifiers, Disqualified Teams, and At Large Selection Status, All for the Top 57 Teams

An interesting question came up this week related to teams disqualified from at large selection due to having a winning percentage below 0.500:  In computing winning percentage for at large disqualification purposes, will the NCAA count ties as half a win or a third of a win?  The following table assumes it will count them as a third of a win, which makes a big difference.


Thursday, September 5, 2024

2024 ARTICLE 4: POST-WEEK-3 NEWS AND UPDATED PREDICTIONS

 Below are updated predictions based on the actual results of games played through Sunday, September 1 and predicted results of games not yet played.  For background information this week, following the predictions there is some information on the win-loss-tie likelihood part of the prediction process.

Team NCAA RPI and Balanced RPI Ranks, Plus NCAA RPI and Balanced RPI Strength of Schedule Contributor Ranks


Conference NCAA RPI and Balanced RPI Ranks Plus NCAA RPI Strength of Schedule Contributor Ranks


Predicted NCAA Tournament Automatic Qualifiers, Disqualified Teams, and At Large Selection Status, All for the Top 57 Teams


Win-Loss-Tie Likelihoods

To predict the results of games not yet played, over the first part of the season my program bases them on assigned pre-season NCAA RPI ratings for teams.  Those ratings are based on team ranks over the last 7 years.  Using the predicted ratings, the program determines the rating difference between each set of opponents, as adjusted for home field advantage.  For that rating difference, the program then assigns a win, loss, and tie likelihood for the game.

The win, loss, and tie likelihoods are based on a study of all games played since 2010 (over 40,000 games, with pre-2022 game results adjusted to treat games decided in overtime as ties).  The study looks at the location-adjusted rating differences between teams and the actual game results.  It produces a Result Probability Table that shows the win, loss, and tie likelihoods in relation to the location-adjusted rating differences between opponents.  For each of this year's future games, the program determines the location-adjusted rating difference between the opponents and then extracts from the Result Probability Table the win, loss, and tie likelihoods for their game.  The program then tallies teams' actual results for games already played and their win, loss, and tie result probabilities for games not yet played to produce teams' predicted end-of-season records.  From there, the program computes teams' predicted RPI ratings and ranks.

The Result Probability Table is reliable, when applied to a large number of games.  For the more than 40,000 games played since 2010, using the RPI bonus and penalty adjustment regime in effect in 2023, but with tie values changed from 1/2 a win to 1/3 of a win in the RPI computation process as is expected for this year, here is how the the actual results for the better rated team in each game compare to the predicted results using the Result Probability Table:

Higher rated team actually wins:  65.08%

Higher rated team actually ties:   21.12%

Higher rated team actually loses:  13.80%

...................................................................... 

Higher rated team predicted wins:  65.06%

Higher rated team predicted ties:  21.18%

Higher rated team predicted losses:  13.76%

This means that, from an overall perspective, when this year's predicted results miss the mark, it is not due to problems with the calculated result probabilities, but rather is due to the pre-season assigned ratings used in predicting game results turning out to not reflect actual team strength.  When this happens, of course, it is not surprising since it is impossible to predict in advance with great accuracy what teams' true strength will be.

Monday, August 26, 2024

2024 ARTICLE 3: POST-WEEK-2 NEWS AND UPDATED PREDICTIONS

I have not found final word on whether the Women's Soccer Committee's recommended changes to the RPI will be in effect this year, but based on the Competition Oversight Committee's approval of the changes, I assume they will.  We know that one recommendation was to change the RPI value of ties from 1/2 a win to 1/3 of a win.  We know that the other recommendation was to change the bonus and penalty structure, but we don't yet know the amounts of the bonuses and penalties.  Given that, I have revised my program to include the tie valuation change but have retained, for now, the previous bonus and penalty structure.

Below are my updated predictions, after incorporating all actual game results through Sunday, August 25.

To give some context and so you can make your own decision on the reliability of the predictions, here are some numbers comparing the actual results of games so far to my predicted results for those games.  Team 1 is the home team or, for neutral site games, the team whose name is first in alphabetical order:

Actual Team 1 wins:  52.3%

Actual Team 1 losses:  29.4%

Actual Team 1 ties:  18.3%

Predicted Team 1 wins:  49.3%

Predicted Team 1 losses:  29.7%

Predicted Team 1 ties:  21.1%

Looking through a different lens, here are numbers comparing (1) the actual results so far for the higher rated team in relation to my assigned pre-season ratings and adjusting for home field advantage to (2) the actual results for all games played from 2010 through 2023 in relation to the NCAA's actual end-of-season ratings and adjusting for home field advantage, with both my assigned pre-season ratings and the NCAA ratings based on valuing ties as 1/3 of a win:

Historically, higher rated team wins:  65.3%

Historically, higher rated team loses:  13.6%

Historically, higher rated team ties:  21.1%

This year, my higher rated team actually wins:  62.6%

This year, my higher rated team actually loses:  19.1%

This year, my higher rated team actually ties:  18.3%

Team NCAA RPI, NCAA Non-Conference RPI, and Balanced RPI Ranks Plus NCAA RPI and Balanced RPI Strength of Schedule Contributor Ranks


Conference NCAA RPI, NCAA Non-Conference RPI, and Balanced RPI Ranks Plus NCAA RPI Strength of Schedule Contributor Ranks


 Predicted NCAA Tournament Automatic Qualifiers, Disqualified Teams, and At Large Selection Status, All for the Top 57 Teams

The table shows Florida, Michigan State, Iowa, SMU, and Georgia all in the Top 57 but being disqualified by having a winning percentage below 0.500.  Lots will change by the end of the season, so I look at these teams only as illustrating, for now, the effect of the change from valuing ties as 1/3 of a win rather than 1/2 a win.  Of the five teams, my program shows Georgia as being below 0.500 whether the tie value is 1/3 or 1/2.  It shows all of the others being below 0.500 with the tie value set at 1/3, but above 0.500 with the value set at 1/2.

If the number of disqualified teams persists, I wonder if the Committee will expand the candidate pool beyond the historic #57 ranked team cutoff.


Monday, August 19, 2024

2024 ARTICLE 2: THIS WEEK'S NEWS AND UPDATED PREDICTIONS

News

There are two big news items this week.  The first is that it appears there will be changes to the NCAA RPI formula, effective this season:

1.  Rather than ties counting as half a win, as has been the case under the RPI formula previously, they now will count as 1/3 of a win.  This now will match how conferences compute conference standings.  It also will match a change already made for men's soccer.

2.  The bonus and penalty adjustment structure will change.  Under the new structure there will be three bonus tiers (rather than the previous two tiers).  The highest bonuses will be for wins and ties against teams ranked 1 to 25.  The middle bonuses will be for wins and ties against teams ranked 26 to 50.  The lowest bonuses will be for wins and ties against teams ranked 51 to 100.  These new tiers match two things:  (1) How the NCAA presents data about teams to the Committee for use in the NCAA Tournament bracket formation process; and (2) How the Committee looks at results, in terms of their quality.  Under the new structure there will continue to be two penalty tiers, but the tiers will be much broader.  The lower penalties will be for ties and losses to teams ranked 151 to 250; and the greater penalties will be for ties and losses to teams ranked 251 and poorer. 

The second item is that the Women's Soccer Committee is proposing that, effective for the 2025 season, it discontinue using the KP Index as a secondary rating system to the NCAA RPI and that it instead use the Massey ratings.  In my opinion, this would be a great change, as the Massey ratings have minimal discrimination in relation to conferences and regions, unlike the NCAA RPI and the KP Index.

Updated Predictions

Here are updated predicted end-of-season ranks, after incorporating all actual game results through Sunday, August 18.  These predictions include the RPI formula change of ties counting as 1/3 win rather than 1/2 win.  They do not include the changes to the bonus-penalty structure since we do not yet know what the new bonus and penalty amounts will be.

Team NCAA RPI, NCAA Non-Conference RPI, and Balanced RPI Ratings and Ranks

In this table, I have added two columns to what I showed last week.  The SoS Contribution Rank ARPI 2015 BPs column shows, for the NCAA RPI, each team's rank under the NCAA RPI formula as a strength of schedule contributor to its opponents' RPIs.  The SoS Contribution Rank URPI 50 50 SoS Iteration 15 column shows each team's rank under the Balanced RPI formula as a strength of schedule contributor.  If you compare teams' NCAA RPI ranks to their NCAA RPI Strength of Schedule Contributor ranks, you will see that they can be quite different.  For the Balanced RPI, you will see that the Balanced RPI ranks and Balanced RPI Strength of Schedule Contributor ranks are essentially identical.  The NCAA RPI's inconsistencies between its RPI ranks and its strength of schedule contributor ranks are a major problem and follow patterns that are the cause for the NCAA RPI's discrimination in relation to conferences and regions.


Conference NCAA RPI, NCAA Non-Conference RPI, and Balanced RPI Ratings and Ranks

In this table, I have added one column to what I showed last week.  The Conference ARPI SoS Contribution Rank column on the right shows, for the NCAA RPI, each conference's rank under the NCAA RPI formula as a strength of schedule contributor to its opponents' RPIs.  If you compare the NCAA RPI ranks to the RPI strength of schedule contributor ranks, you will see which conferences benefit from the disconnect between NCAA RPI's ranks and strength of schedule contributor ranks and which conferences are hurt.


Predicted Final NCAA Tournament Automatic Qualifiers and At Large Selection Status

These are the Top 57 in the RPI ranks at large candidate group, arranged in order of their likelihoods of getting at large selections.


Friday, August 16, 2024

2024 ARTICLE 1: PRE-SEASON PREDICTIONS FOR THE 2024 SEASON

Each year, my computer applies a program to the full season schedule to predict where teams will end up in the RPI rankings at the end of the season (including conference tournaments).  It also predicts where teams will stand in relation to automatic qualification for and at large selections (and also seeds) for the NCAA Tournament.  This article shows the program's pre-season predictions.

But first some background on the program, which I will put in this article and not repeat in my weekly updates.  You can use the background to do your own assessment of the reliability of the program's predictions.

Background

The program predicts the outcome of each game by comparing a pre-season NCAA RPI rating I have assigned to each team involved in the game and taking into account the value of home field advantage.  (Home field is worth 0.0166 in relation to the rating difference between the two opponents.)  In predicting the outcome of each game, for purposes of the rating computations, the program does not simply award the higher rated team a win.  Rather, for each game it assigns a win, tie, and loss probability based on historic probabilities in relation to opponents' location-adjusted rating differences.  This avoids, for example, having a team with a 51.0% win probability in each of 10 games being awarded a win in each game.  Instead, it creates a record for the team of 5.1 wins, 2.8 ties, and 2.1 losses, reflecting that the win probability in each game is 51.0%, the tie probability is 27.7%, and the loss probability 21.3%.  From a statistical perspective, this is the record one would expect for the 10 games (of course, rounded off to whole numbers for actual game outcomes) rather than expecting the team to win all 10.

Teams' predicted RPI ratings are based on teams' average Balanced RPI ranks over the last 7 years.  I use the last 7 years because, of the possible measures I have considered, using that average produces the best match with the next year's ratings.  The measures I have considered include average NCAA RPI ranks over the last 1, 2, 3, ... 15 years and average Balanced RPI ranks likewise over those numbers of years.  Once I have the 7 year average Balanced RPI ranks of teams, I put them in order from best to worst, assign them rank positions, and then assign each team the average historic NCAA RPI rating associated with its rank.

Using this method, the program does best at predicting where teams' ranks will end up at the top and bottom ends of the rankings and the poorest in the middle.  This is because the ratings are most spread out at the top and bottom of the rankings and most compressed in the middle.  Thus at the top and bottom of the rankings, a predicted rating "error" of X may not be sufficient to change teams' ranks, in other words will be inconsequential.  In the middle of the rankings, however, the same rating "error" may be equivalent to a significant number of rank position changes.

From an NCAA Tournament perspective, the teams that matter are the NCAA RPI Top 57 (see below).  Based on a review I did applying the program to the 2022 season, a reasonable expectation for teams ending up in the NCAA RPI Top 100 is that teams in the following rank groups will have actual end-of-season ranks, on average, within the indicated number of positions of their pre-season predicted ranks:

Teams ranked 1 through 10:  2 positions

Teams ranked 11 through 20:  3 positions

Teams ranked 21 through 50:  8 positions

Teams ranked 51 through 100:  12 positions 

The other thing to bear in mind is the NCAA RPI rank groups that, based on past history, are candidate groups for NCAA Tournament seeds and at large selections at the end of the season.  These are as follows:

#1 Seeds: teams ranked #7 or better

#2 Seeds: teams ranked #14 or better

#3 Seeds: teams ranked #23 or better

#4 Seeds: teams ranked #26 or better

#5-6 Seeds: teams ranked #30 or better

#7-8 Seeds: teams ranked #49 or better  

At Large: teams ranked #57 or better

The way the system works, the initial predicted end-of-season results I will show here are based on predicted results for all games.  At the end of each weekend, when all the previous week's actual game results are available, I change the predicted results for those games to the actual results and re-compute to get new end-of-season predictions.  Thus at the beginning of the season, the predicted end-of-season results are likely to have the reliability indicated above.  Each week, as I substitute actual results for predicted results, the predicted end-of-season results should be more reliable.

Further, after Week 5 of the season, I will stop using the pre-season predicted ratings as a basis for predicting future game results and instead will use teams' then current actual RPI ratings as the basis for predictions.  This will coincide with the NCAA's release of its first official RPI ratings and ranks for the season.

Predicted Final Ratings and Ranks

Here are this year's predicted final ratings and ranks.  They include the NCAA RPI, NCAA Non-Conference RPI, and Balanced RPI.  For detailed explanation of those three sets of ratings, use these links:

NCAA RPI

 NCAA Non-Conference RPI

Balanced RPI 

In the table, the Adjusted RPI 2015 BPs is the NCAA RPI, the Adjusted NCRPI 2015 BPs is the NCAA Non-Conference RPI, and the URPI 50 50 SoS Iteration 15 is the Balanced RPI.  The regions are based on the states where the teams are located and where the teams from their states play the majority or plurality of their games.


 Predicted Final NCAA Tournament Automatic Qualifiers and At Large Selection Status

The following table is for the Top 57 teams in the above NCAA RPI ranks, which historically has been the NCAA Tournament at large selection candidate group.  It has the teams arranged in order of their likelihood of getting at large selections.  (Later in the season, I will include some refinements related to likely at large selections and also likely seeds.)  For a detailed explanation of the table and what it means, use this link:

The table also shows which teams the program identifies as Automatic Qualifiers and which ones it identifies as having below 0.500 records and thus being disqualified from at large selection.  The most likely at large selections are the Top 34 teams in the table that are not Automatic Qualifiers and not disqualified due to below 0.500 records.


Projected Final Conference Ratings and Ranks


Monday, March 25, 2024

NCAA TOURNAMENT: LIKELY AT LARGE CANDIDATE POOL AND SELECTION CHANGES IF THE COMMITTEE HAD USED THE BALANCED RPI RATHER THAN THE NCAA RPI

This article is on the question: Would it make a difference in NCAA Tournament at large selections if the Women's Soccer Committee used the Balanced RPI rather than the NCAA RPI?

The period covered is 2007 through 2023 (excluding Covid-affected 2020).  To determine what the at large selections would have been if the Committee had used the Balanced RPI, I took two steps:

1.  I assumed that under the Balanced RPI all at large selections would come from the Balanced RPI Top 57 teams.  I assumed this because since 2007, all at large selections have come from the NCAA RPI Top 57 teams (based on the current NCAA RPI formula).  From a practical perspective, there is no reason to think this would be different if the Committee were using the Balanced RPI: Everything would look similar to the Committee, it simply would looking at different rating numbers.

2.  One of the factors I use in evaluating Committee decisions is teams' good results (wins or ties) against Top 50 opponents.  I score these results using a system that is very heavily weighted towards good results against very highly ranked opponents.  Then I rank teams based on these scores.  Once I have these ranks, I combine them with their RPI ranks, with each rank weighted at 50%.  I then rank teams using their combined rank scores.  When I do that, the ranks on average match the Committee at large selections for all but 2 selections per year.  With that in mind, to see what the at large selections likely would have been if the Committee were using the Balanced RPI, I determine what their Top 50 results scores would have been using the Balanced RPI, rank teams accordingly, see what their combined Balanced RPI and Top 50 results score ranks would be with each weighted 50%, and rank them accordingly just as I do for the NCAA RPI and Top 50 results ranks.  I then assume that if the Committee were using the Balanced RPI, it would select teams based on their combined Balanced RPI and Top 50 results rank.

Looking at the numbers from 2007 through 2023, a change to the Balanced RPI would result, on average, in 6.3 new teams in the Top 57 per year -- in other words about 6 new teams per year would become candidates for at large selections and a matching 6 using the NCAA RPI would not be candidates.  Further, and more important, 3.6 different teams per year would get at large selections -- in other words 3 to 4 teams per year that did not get at large selections under the NCAA RPI would get them under the Balanced RPI and 3 to 4 teams that did get at large selections under the NCAA RPI would not get them.  Thus the answer to the question at the opening of this article is

Yes, it would make a difference in NCAA Tournament at large selections if the Women's Soccer Committee used the Balanced RPI rather than the NCAA RPI, to the tune of 3 to 4 different teams per year getting at large selections, on average.

When looking at conferences, here are the results of a rating system change for the 2007 through 2023 period:


In the table, the Net At Large Gain or Loss column shows the difference between the Committee's actual at large selections using the NCAA RPI and what the selections likely would have been if the Committee had used the Balanced RPI.

As you can see, the conference hurt the most by the NCAA RPI is the Big 10, which lost 16 at large positions from 2007 through 2023 due to use of the NCAA RPI, or 1 position per year on average.  Of the five conferences hurt by the NCAA RPI, three are from the West:  the Pac12, West Coast, and Big West conferences.  The other conference hurt is the ACC.

The conferences that benefit the most from the NCAA RPI are the Big East, SEC, Colonial, American, Atlantic Ten, and Big 12, with a number of other conferences helped just once over the 16-year period.

In the table, the Net Top 57 Gain or Loss column shows the difference in the number of teams a conference had in the Top 57 candidate pools for at large selections.  Note that 4 of the 6 conferences hurt by the NCAA RPI are from the West.

When looking a geographic regions, here are the results of a rating system change:


NOTE:  There are two sets of "new" at large selections under the Balanced RPI.  One set is teams that were outside the NCAA RPI Top 57 that, on coming into the Top 57 under the Balanced RPI, get at large selections.  The second set is teams that were inside the NCAA RPI Top 57 and did not get at large selections, but that under the Balanced RPI would get at large selections.  In the table, the Middle region is an example of having some from each set.

In the next post, I will pull together key information from this and other recent posts to show how all the information inter-relates.


Sunday, March 10, 2024

A LOOK AT THE COMMITTEE'S NCAA TOURNAMENT BRACKET DECISIONS BATTING AVERAGE, 2011 - 2023

This is a review of how teams from the different regions and conferences do in NCAA Tournaments, as compared to how the Women's Soccer Committee expects them to do as indicated by its bracketing decisions.  The review covers the period from 2011 to 2023.  It starts at 2011 because in 2010 and earlier, seeded teams were not guaranteed to host first round games.

The review method assumes that for any pairing of teams:

1.  In a game between a seeded team and an unseeded team, the Committee expects the seeded team to win;

2.  In a game between two seeded teams, the Committee expects the better seeded team to win; 

3.  In a game between unseeded teams where the Committee awards one of them home field, the Committee expects the home team to win; and

4.  In a game between unseeded teams at a neutral site, the Committee has no expectation as to which team will win.

The review looks at the data through three lenses:

1.  Actual Games Played.  It looks at games teams actually played:

a.  For each game, it compares the Committee's expected result to the actual result.

 b.  For each team, for the games it played, it then tallies its expected wins and its actual wins.

c.  For each team, it then subtracts its expected wins from its actual wins.  If the result is a + number, it means the team won that many more of its games than the Committee expected.  If the result is a - number, it means the team won that many fewer.

d.  It then sums up the results from Step c by region and by conference, to see what the regions' and conferences' net results in actual games have been as compared to the Committee's expectations.

e.  It then expresses the results from Step d as a percentage of all games the region's or conference's teams played. 

2.  Expected Games.  It looks at how the Committee initially expected the bracket to play out:

a.  For each team, it looks at the number of games the Committee expected the team to win over the course of the Tournament.  For example, the Committee expects the overall #1 team (top left of the bracket) to win the championship, which means winning 6 games.  It expects the overall #2 team (bottom right) to win 5 games.

b,  For each team, it tallies the number of games it actually won.

c.  For each team, it then subtracts its expected wins from its actual wins.

d.  It then sums up the results from Step c by region and by conference, to see what the regions' and conferences' actual results have been as compared to the results the Committee expected them to have over the course of the Tournament.

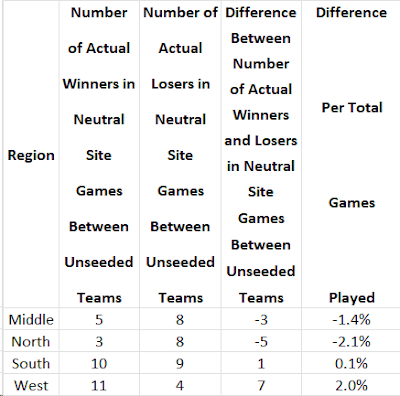
3.  Unseeded Opponents at Neutral Sites.  Method 1 leaves out one set of games: those between unseeded opponents at neutral sites.  In each of these games, at least one of the opponents has upset its opponent in a preceding round.  Since neither team is seeded and the game is at a neutral site, it is not possible to say that the Committee expected one or the other team to win.  On average, there are 2 to 3 games per year in this category. For these games:

a. For each region and conference, it sums up the number of games its teams won and the number they lost.

b.  For each region and conference, it then subtracts its number of games lost from its number of games won.  A + result means the region or conference won that many more than it lost and a - result means it lost that many more than it won.

c.   It then expresses the results from Step b as a percentage of all games the region's or conference's teams played.

Here are the results of the review, first by regions and then by conferences:

Regions

Teams' regions are based on the states where they are located.  The states are assigned to the regions in which the states' teams play the majority (or plurality) of their games.

Actual Games Played Method


Using the Middle region as an example, from 2011 through 2023, the net difference between the games it actually won and the games the Committee expected it to win is 10.  In other words, it won 10 more games than the Committee expected.  Its teams played a total of 215 games.  So its winning 10 more games than expected represents it performing better than the Committee expected in 4.7% of its games.

An important feature of this and all the other methods is that the net differences always represent games against teams from other regions.  This is because in games between two teams from the same region, if one unexpectedly wins a game then the other unexpectedly loses and the win and loss cancel each other out thus producing a net difference of 0 for that game.

The notable feature of this table is that the Middle, North, and West regions all have positive net differences.  The South region has a negative net difference.

Expected Games Method


Here, the results are similar, but not identical, to those for the Actual Games Played method.  Again, the Middle, North, and West region have positive net differences.  The South has a negative net difference.

Unseeded Opponents At Neutral Sites Method


The notable feature of this table is that the West region teams tend to prevail in these games, at the expense of teams from the Middle and North regions.

Conferences

Actual Games Played Method


In the table, I have arranged the conferences in order with those that have won the highest percentage of games, as compared to expected wins, at the top.

The table covers 12 years of games.  Some conferences show fewer than 12 games due to conference membership changes over the 2011 to 2023 time frame.  For the conferences that have few games, I tend to not take the numbers very seriously -- the data sample is very small.  Taking that into consideration, here is what I see in the numbers from the other conferences:
  • Tournament teams from some of the mid-majors tend to do better than the Committee expects.
  • From the Power 5 conferences, the Big 10 does better than the Committee expects and the ACC does just as the Committee expects.  The Pac 12 does a little more poorly than the Committee expects.  The SEC and especially the Big 12 do more poorly than the Committee expects.
Expected Games Method


The table shows that the Big 10 does better than the Committee expects, followed by the Big West, West Coast, and Colonial conferences.  At the other end of the spectrum, the Pac 12 and Big 12 do considerably more poorly than the Committee expects, followed by the SEC and ACC.

An interesting aspect of this table, in relation to the bracketing rules, is the relationship among the Big West and West Coast conferences on the one hand and the Pac 12 conference on the other.  To a good extent, the Big West and West Coast teams' performing better than the Committee expects is at the expense of the Pac 12 conference, since the Big West and West Coast conference teams are the ones the Pac 12 teams tend to play in the early rounds of the Tournament, due to the NCAA's bracket formation rules (including the required use of the RPI and the travel expense limitation policy).

Another interesting aspect is that the Big 10 performs better than the Committee expects, but the other Power 5 conferences perform more poorly.

Unseeded Opponents At Neutral Sites Method


The notable feature from this table is that the Big West, West Coast, and Pac 12 conferences perform the best in these games.  They all are from the West region.  Teams from the other 4 Power 5 conferences perform at or close to a 50-50 ratio.  The West region conferences' good performance is balanced out by weak performance by teams from non-Power 5 conferences.

Summary and Comment

Looking at regions, teams from the South perform more poorly than the Committee expects.

Looking at conferences:

Although most of the ACC teams are in the South, its teams perform about as the Committee expects.  The SEC and Big 12, on the other hand, perform more poorly than the Committee expects.

From the West, the Big West and West Coast conferences perform better than the Committee expects, apparently at the expense of the Pac 12.  This suggests an unusually high degree of parity in the West.  Coupled with the other numbers above, it appears that the NCAA bracketing rules do not do well when there is a high degree of parity in a region.

From the Middle, teams from the Big 10 perform better than the Committee expects.

Comment:  Altogether, the numbers suggest that the NCAA bracketing rules result in there not being equal treatment among the regions and among some of the stronger conferences.  The Committee could improve on this by tracking "longitudinal" data and results such as I have done here and taking the data and results into consideration during the bracketing process.