Thursday, June 1, 2023

IT’S TIME TO CHANGE THE RPI

In the past, I have written extensively about the defects in the version of the RPI the NCAA currently uses for Division 1 women’s soccer.  After many experiments, I now have a version of the RPI whose format is credible and that is far superior to the current RPI, eliminating all of its problems.  I call it the Balanced RPI.

Based on a review of the seasons from 2007 through 2022, the Balanced RPI likely would have resulted in 3 to 4 different at large selections per year.  The Big 10 likely would have received about 1 additional selection per year, followed by the West Coast Conference and Pac 12 and then the ACC in terms of other conferences receiving additional positions.  The Big East, SEC, Big 12, American, and Colonial conferences would have received fewer positions.  Given the far superiority of the Balanced RPI over the currently used RPI, the additional positions some conferences would have received are positions they deserved but were denied simply because of the RPI’s defects and the NCAA’s insistence that the Committee use, and only use, the RPI.  Similarly, the positions some conferences would have lost are positions they were given simply because of the RPI’s defects.

Ideally, the NCAA will move to using the Balanced RPI for Division 1 women’s soccer.  As an alternative, it could use the Balanced RPI as a supplemental rating resource for the Women’s Soccer Committee.  And as a minimum, it should allow the Committee to use the Balanced RPI as a supplemental resource on an experimental basis, starting this year.

To help things along, this year in my weekly publications during the season, I will be showing how teams’ current NCAA RPI ranks compare to their Balanced RPI ranks.  And, in my weekly simulations of NCAA Tournament at large selections, I will compare the projected at large selections based on the current NCAA RPI with projected selections based on the Balanced RPI.  And, at the end of the season, I will compare the Committee’s actual at large selections with what they likely would have been if the Committee had used the Balanced RPI rather than the current NCAA RPI.

You do not have to just take my word for it.  At the RPI for Division 1 Women’s Soccer website, on the RPI: Modified RPI? page, I have provided the formula for the Balanced RPI, a detailed comparison of the current NCAA RPI to the Balanced RPI demonstrating why the Balanced RPI is far superior, and a link to an Excel workbook that has a detailed comparison of past actual at large selections to what they likely would have been if the Committee had been using the Balanced RPI.  Absolutely everything is as objective, open, and reviewable as I can make it, and I have high confidence in my conclusions.  Nevertheless, do your own review and make your own judgments.

Monday, December 26, 2022

ANOTHER WAY TO LOOK AT HOW RPI DEFECTS RELATE TO SCHEDULING

In my work on non-conference scheduling in relation to the RPI and the team profile factors important during the NCAA Tournament bracket formation process, I occasionally have made this observation:

From an RPI perspective, and also from the perspective of wanting to play opponents the Committee will consider strong, you should consider the following:

The top teams from strong conferences are good opponents, both from an RPI perspective and to impress the Committee;

Once you get beyond the top teams from strong conferences, the teams lower in those conferences’ standings can be poor teams to play from an RPI perspective and because the Committee will think those teams are weaker than they really are;

On the other hand, the top teams from second and third tier conferences can be good teams to play from an RPI perspective and the Committee will think those teams are better than they really are; and

If you have two teams with RPI ranks about the same, one from a strong conference and the other from a second or third tier conference, you virtually always are better off playing the team from a second or third tier conference. 

To test this observation, I did a study as follows:

For my data base, I used data from 2013 to the present (but excluding the 2020 Covid year).  I started at 2013 because that was the first year following completion of the last major realignment of conference teams.

For each conference, for each final standing position within the conference, I determined:

1.  Average RPI Rank for that position using the current NCAA formula; 

2.  Average rank for that position, under the current NCAA RPI formula, as a contributor to opponents’ strengths of schedule.

3.  Average Massey Rank for that position; and

4.  Average Improved RPI Rank for that position.

The Improved RPI is my revised version of the RPI.  It produces ratings and ranks that are superior to the RPI by all measures I can think of (but with a more complicated formula).  Massey likewise produces ratings superior to the RPI.  The Massey and Improved RPI Ranks for teams generally are quite similar, but not identical.  For Division I women’s soccer, the Massey and Improved RPI ranks are the best measures available of true team strength as demonstrated by team performance.

With those numbers, I then determined for each standing position in each conference:

5.  The difference between average RPI Rank and average rank as a strength of schedule contributor;

6.  The difference between average Massey Rank (actual strength) and RPI Rank (perceived strength per the NCAA rating system); and

7.  The difference between average Improved RPI Rank (actual strength) and RPI Rank (perceived strength per the NCAA rating system).

Finally, I determined for each standing position within each conference:

8.  The sum of 5 and 6; and

9.  The sum of 5 and 7.

Putting all of these numbers produces the following table for the ACC:


 Looking at the #1 standing position in the ACC, the Average ARPI Less SoS Contribution Ranks Difference column shows that you can expect its rank as a strength of schedule contributor to be 3.1 positions poorer than its RPI Rank says it should be.  Its Average Improved RPI less ARPI Ranks Difference column shows that you can expect its Improved RPI Rank (true strength) to be 0.3 positions better than the RPI says.  Its Average Massey less ARPI Ranks Difference column shows that you can expect its Massey Rank (true strength) to be 0.4 positions better than the RPI says.

If you put the strength of schedule contributor difference together with the Improved RPI difference, you get a total of -2.8.  Put together with the Massey difference you get -2.7.  These numbers are pretty small.  What this means is that on balance, if you play the ACC #1 team in any year, their RPI Rank will be pretty close to both their true strength and what they will do for your strength of schedule portion of the RPI formula.

On the other hand, take a look at the #9 ACC team.  For this team, the Average ARPI Less SoS Contribution Ranks Difference column shows that you can expect its rank as a strength of schedule contributor to be 45.9 positions poorer than its RPI Rank says it should be!  Its Average Improved RPI less ARPI Ranks Difference column shows that you can expect its Improved RPI Rank (true strength) to be 14.3 positions better than the RPI says!  Its Average Massey less ARPI Ranks Difference column shows that you can expect its Massey Rank (true strength) to be 16.3 positions better than the RPI says!

If you put the strength of schedule contributor difference together with the Improved RPI difference, you get a total of -60.2.  Put together with the Massey difference you get -62.2.  In other words, you can expect the #9 ACC team to be significantly stronger than the RPI says it is and you can expect its rank as a strength of schedule contributor within the RPI formula to be significantly poor than even its RPI says it should be.

In the table, I have used the color highlighting to show, for each conference, which standing positions within the conference are "desirable" opponents from the combined perspective of these numbers and which are "undesirable."  Green highlighting indicates desirable and orange undesirable.  I have designated a combined number of +10 or more as desirable and of -10 or less as undesirable.  For standing positions between these two benchmarks, there is no color coding which means that there is no significant advantage or disadvantage, from the perspective of these numbers, in playing those teams -- they are Neutral from this perspective.  In the Conference Teams by Rank in Conference column, the green and orange color coding appear only when both right-hand columns are that color.  If only one is that color, the rank position will have no color and thus be a neutral team in terms of opponent desirability.

[NOTE:  Although the table may show teams as desirable or undesirable, this is only from the perspective discussed in this article.  For other reasons, including from an NCAA Tournament perspective, it may be good to play a team identified here as undesirable -- such as to play a team the RPI ranks in the Top 50.]

Thus for the ACC, if you play the #1 or #2 team in the conference, the lack of highlighting means it will be pretty much be a neutral "What you see is what you get" in terms of their RPI Rank in relation to their true strength and their rank as a strength of schedule contributor.  For #3 or poorer in the conference, however, the orange highlighting means you can expect their RPI Rank and their rank as a strength of schedule contributor combined will understate their true strength.

With that explanation, the table below covers all of the conferences.  It shows, in stark clarity, how the RPI discriminates in relation to conferences and their teams.  You will have to scroll to the right to see the entire table.  Below this table will be another that applies to geographic regions.


The next table is for teams in the four geographic areas I have identified based on the states where schools are located.  The table shows averages by rank among the teams in the region.  Most stark in this table is the West region.  It has only a handful of rank positions that are neutral.  All other positions are undesirable as opponents under the considerations I am addressing here (although they nevertheless might be desirable opponents based on other NCAA Tournament-related considerations).  Again, you will have to scroll to the right to see the entire table.


Monday, December 19, 2022

REVIEW OF DECISIONS THE NCAA D1 WOMEN’S SOCCER COMMITTEE MADE FOR THE 2022 NCAA TOURNAMENT

Here is a review of some Committee #1 through #4 seeds and at large selections for this year’s NCAA Tournament.  I have not yet analyzed the new #5 through #8 seeds that the Committee did for the first time this year, so I am not yet able to discuss those decisions.

#1 Seeds

Based on the factor analysis I do, there was one question the Committee needed to answer: As between North Carolina and Alabama, who should get a #1 seed?

Based on my factor standards, North Carolina met 2 standards that said "Yes," a team that meets this standard always has gotten a #1 seed.  It met no standards that said "No," a team that meets this standard never has gotten a #1 seed.  Thus ordinarily it would have gotten a #1 seed.

But, Alabama met 4 Yes and 2 No standards.  What this means is Alabama had a profile the Committee has not seen before (with "before" meaning over the years going back to 2007).  Thus the circumstances forced the Committee to make a decision it has not had to make before.

The Committee gave Alabama the #1 seed.  This leads me to look at the No standards Alabama met -- which in the future no longer will be No standards due to the Alabama #1 seed decision.  The two No standards were for paired factors.  A paired factor involves two of the factors the Committee considers.  Each factor has a scoring system -- either the NCAA-specified system or, if there is no NCAA-specified system, a system I have created.  To determine a paired factor score, I apply a formula that combines the two individual factor scores so that each individual factor has a 50% weight.  The two No standard paired factors were Alabama’s (1)Non-Conference RPI and Poor Results Score and (2) NCRPI Rank and Poor Results Score.  Thus both involved poor results.  My poor results scoring system considers ties and losses against teams ranked #56 or poorer as poor results and assigns negative values for those results depending on whether the game was a tie or a loss and on the rank tier in which the opponent falls.  Alabama’s poor results, in my scoring system, were a loss at #75 Miami FL and a tie at #61 Utah.

Looking at the Yes standards North Carolina and Alabama met also may add some insight.  The two North Carolina Yes standards were for paired factors: (1) RPI and Conference Rank and (2) Conference Standing and Conference RPI.  Thus both standards involved conference strength.  The four Alabama Yes standards also were for paired factors.  Two of these involved conference strength.  Two of them, however, did not: (1) RPI Rank and Top 60 Head to Head Results Score and (2) RPI Rank and Top 60 Common Opponents Results Score.

Since the Committee gave the #1 seed to Alabama, this suggests to me that the Committee may not have given as heavy weight to the Alabama tie with Utah poor result as it might have in the past.  This would make some sense, as the NCAA rule change this year to no overtimes during the regular season means there will be more ties and, in fact, the number of ties this year was double the number in prior years.  This was exactly as expected based on the number of games historically decided by golden goals in overtime but now ending in ties.  With more tie games, one would expect teams to receive greater numbers of tie game poor results.  This, in turn, might cause the Committee to be more tolerant of tie game poor results in its decision-making process.

If this is what happened in relation to the Alabama poor results, then it simply was a matter of which team had better Yes characteristics and the Committee could have concluded Alabama had the better characteristics.  

#2 Seeds

Penn State likewise had a profile the Committee has not seen before.  It met 6 Yes and 25 No standards.  That looks like a lot of No standards, but 24 of them involve poor results: a loss to #58 Nebraska and ties with #169 Indiana and #119 Iowa.  The Committee gave Penn State a #2 seed.  Coupled with the Alabama decision, this further suggests the Committee being more tolerant of tie game poor results.

St. Louis had another profile the Committee has not seen before, meeting 3 Yes and 23 No standards.  All of the no standards involved its conference RPI or its conference rank.  For context, historically, no teams from a conference ranked #9 or poorer has gotten a #1 or #2 seed.  This year, the Atlantic 10 was ranked #10.  The Committee clearly decided conference strength did not carry enough weight to bar a #2 seed.

On the other side, Stanford met 6 Yes and 0 No standards.  Interestingly, 2 of the Yes standards were for paired factors that included Conference Rank.  Considered together with North Carolina’s 2 Yes #1 seed standards having involved conference strength, this may indicate that conference strength does not carry as much weight as my conference strength standards previously have suggested.  Stanford’s other Yes standards involved poor results, in this case it having had no poor results.

As for Penn State’s 6 Yes standards, they all involved its Non-Conference RPI, which was the best of all teams.  This apparently was enough to get it a #2 seed ahead of Stanford.

In terms of St. Louis’s 3 Yes standards, they all involved its having had no poor results, which matched Stanford’s 4 Yes standards involving no poor results.  This left Stanford with 2 additional standards involving conference strength.  Given that Stanford did not get a #2 seed, and coupled with St. Louis getting a #2 seed and North Carolina not getting a #1 seed, this means that I will have to change my standards related to conference strength so that conference strength is less helpful (or hurtful) than my standards previously indicated.  This does not necessarily mean a change in the Committee’s treatment of conference strength.  It may simply be a matter of the Committee having to make decisions on how much it values different factors when given team profiles it has not seen before.  Whatever the explanation, at least as to #1 and #2 seeds, it appears conference strength is not as important a consideration as my standards previously indicated.

#3 Seeds

It looks like the last #3 seed spot came to a choice between Arkansas, Pittsburgh, and Michigan State.  The Committee gave the spot to Arkansas, which met no Yes and no No standards.

Pittsburgh, on the other hand, met 6 Yes and no No standards, with only two of the Yes standards involving conference strength.  The 4 other Yes standards were for paired factors involving its RPI, its RPI Rank, its Non-Conference RPI, and its NCRPI Rank, each paired with its results against Top 50 opponents.  The Top 50 Results factor assigns teams scores for positive results (wins and ties) against Top 50 opponents on a sliding scale based on opponent rank, with the scoring heavily skewed towards positive results against highly ranked opponents.

As between Arkansas and Pittsburgh, Arkansas’s good Top 50 results were a win over Michigan State #15, a tie at BYU #20, a win over Auburn #50, a win at South Carolina #12, a win over Texas A&M #40, a win over Vanderbilt #49, a tie with LSU #33, and a neutral site tie with Vanderbilt #49.  Pittsburgh’s good Top 50 results were a win over Liberty #48, a win at Virginia Tech #46, a win at Notre Dame #4, a tie with Clemson #19, and a tie at Notre Dame #4.  And, the Committee gave Notre Dame a #1 seed.  In my scoring system, the Pittsburgh good results against #4 Notre Dame are very valuable and put it well ahead of Arkansas in Top 50 Results Score and Rank.  Nevertheless, the Committee gave the #3 seed to Arkansas, which may be a departure from its historic patterns.

As between Arkansas and Michigan State, Michigan State met 1 Yes and 0 No standards.  The Yes standard was for the paired factor of Top 50 Results Rank and Top 60 Head to Head Score.  Michigan State scored better than Arkansas on each factor in that factor pair.  In this case, however, they played each other at Arkansas, and Arkansas won, which could account for the Committee preferring it over Michigan State.

#4 Seeds

Pittsburgh and Michigan State were clear #4 seeds.  For the remaining slots, the candidates looked to me like Georgetown with 0 Yes and 0 No standards, Southern California with 1 Yes and 1 No standard (new profile for the Committee), and TCU with 0 Yes and 0 No standards.  The Committee gave one slot to Southern California, but gave the other slot to Northwestern with 0 Yes and 2 No standards.

Each Northwestern No standard involved poor results.  Its poor results were a tie at Oakland #106, a loss at Kansas #108, and a loss against Iowa #119.

The Southern California No standard likewise involved poor results.  Its poor results were ties at Nebraska #58, at Utah #61, and at Colorado #65 and a loss at Purdue #182.  Its Yes standard was for the paired factor of Conference Rank and Top 60 Head to Head Results Rank.  It is worth noting that Southern California also had home wins over #3 UCLA (a #1 seed), #11 Stanford (a #3 seed), and #21 TCU (one of the #4 seed candidates).  It appears that the Committee valued the Southern California good results and discounted its poor results.

Altogether, it appears the Committee again discounted poor tie results and, having given Southern California a #4 seed based on its good results, was left with a choice of Northwestern, Georgetown, or TCU for the last #4 seed slot, with all relatively equal once it had discounted the Northwestern poor results.  It gave Northwestern the #4 seed and gave Georgetown and TCU #5 seeds.

Summary Comments on Seeds

It is reasonably clear that for seeds the Committee discounted poor tie results from how they would have counted in the past.  This seems appropriate given the doubling of the number of ties due to elimination of overtimes during the regular season.

The Committee also had to address how much weight to assign to conference strength, making decisions suggesting that for seeds it does not assign as much weight to conference strength as might previously have appeared to be the case.

At Large

Almost all of the Committee at large selections were consistent with its historic patterns.  Only two selections merit discussion.  The teams that the Committee selected that need some discussion are NC State with 6 Yes and 3 No standards, Xavier with 15 Yes and 4 No standards, Utah Valley with 0 Yes and 1 No standard, and Virginia Tech with 8 Yes and 2 No standards.  The teams the Committee did not select that need some discussion are Arizona with 1 Yes and 0 No standards and Wisconsin with 0 Yes and 0 No standards.

NC State, with its 6 Yes and 3 No standards, had a profile new to the Committee and got an at large position.  Its standing in the ACC was #11.  All three of the No standards it met involved its standing within the conference.  Forced to make a decision on how much weight to assign its #11 conference position, the Committee assigned less weight than past precedent might have suggested and gave NC State the position.  In fact, apparently based on the strength of its Yes standards, the Committee gave it a #8 seed.

Xavier, with 15 Yes and 4 No standards, had an RPI rank of #25.  Historically, all teams with RPI ranks of #30 or better have gotten at large selections.  A way to look at this is: If the Committee were not to give an at large position to a team ranked #25, and instead were to give it to a team ranked in the 50s, it essentially would be a disavowal of the RPI as a useful tool.  Although in theory the Committee could make such a decision, it would be extremely difficult to do it.  So, for practical purposes Xavier was going to get an at large selection, whatever its negative characteristics.  In this particular case, Xavier had plenty of positive characteristics to outweight the negatives, but it is likely its RPI rank was determinative.

Virginia Tech, with its 8 Yes and 2 No standards, played a weak non-conference schedule but had some good conference results -- particulary a win over #5 North Carolina and a tie with #10 Virginia.  It finished at #8 in the ACC.  Both of its No standards involved its non-conference RPI and its standing in the ACC.  The Committee valued its positive characteristics enough to discount its negatives.

For Utah Valley, with 0 Yes and 1 No standard, the No standard was the paired factor Conference Rank (#12) and Poor Results.  Its poor results were tie at Boise State #155, tie at New Mexico State #67, loss at Seattle #107, and loss at New Mexico State #67.  Once again, it seems likely the Committee discounted ties in relation to poor results or discounted poor conference rank (as with St. Louis in relation to its #2 seed) or discounted both.  Plus, Utah Valley had a win over #20 BYU and a tie with #22 UCF.

For Arizona, on the other hand, with 1 Yes and 0 No standards, its Yes standard was the factor pair Conference Rank (#2) and Poor Results Rank.  Its only outstanding result was a win at #18 Southern California.  My best guess is that the Committee, in preferring Utah Valley over Arizona, did not assign a lot of weight to their conference strength difference, did not give much weight to poor results, and valued Utah Valley’s two good results higher than Arizona’s one good result.

As for Wisconsin, its only really good result was a win at#21 TCU.  As with Arizona, it appears the Committee valued Utah Valley’s two good results higher than that one good result.

Overall for at larges, the Committee decisions all appear reasonable.  They also appear consistent with what I saw with seeds in relation to the discounting of poor results as a factor and less weight being assigned to conference strength than one previously might have expected.

Monday, November 7, 2022

FINAL ACTUAL RPI RATINGS FOR 2022 SEASON

Use the following link for access to an Excel workbook with actual RPI ratings and ranks and other data for teams based on games through October 30, 2022: RPI Report 11.6.22 Final.  On the left of the RPI Report sheet, there are five color coded columns.  These columns are based on the seasons from 2007 to the present (excluding the 2020 Covid-constrained season).  They show the rank ranges from which #1 through #4 seeds have come.  They also show the at large bubble range and that teams ranked #30 or better as of this stage of the season always have gotten at large selections.

The big unknown this year is whether the change to no overtimes during the regular season will affect the Committee decision patterns.  The second unknown is what the patterns will be for seeding teams 17 through 32.

Sunday, November 6, 2022

FINAL EVALUATION OF TEAMS FOR NCAA TOURNAMENT PURPOSES

Below are tables showing NCAA Tournament seed and at large selection candidate groups based on all results for the season.

For the candidate groups for seeds and at large selections, each table shows how many historic patterns each team meets indicating that the team will or will not get a positive decision from the Committee.  In addition, I have indicated potential Committee decisions based on the patterns.  If there are positions open for which there are not clear seeds or at large selections, an additional table shows a potential basis for filling those positions.  Each set of tables simply reflects Committee decision patterns from 2007 to the present.

In addition to the four pods of #1 through #4 seeds, the Committee this year will create four pods of #5 through #8 seeds.  The Committee has not done this before, so there are no directly applicable decision patterns to apply to the data.  Since 2010, however, the Committee each year has had 16 first round games involving unseeded opponents.  In those games, it appears the Committee has awarded home field to the team it concluded had performed better over the course of the season.  Since this is as good as we will get until the Committee actually has seeded four new pods, I have used the Committee patterns for selecting home teams for those games as a basis for projecting teams to be in the #17 through #32 seed range that will fill the four new pods.

To be clear:  All of the seeds and at large selections shown below are based on the assumption that  the Committee will follow its historic patterns, which may not happen.

In addition, there are some teams that have profiles the Committee has not seen before.  These show up as teams that meet some historic standards for always getting a positive Committee decision but at the same time meet some historic standards for never getting a positive Committee decision.  In these cases, I include the teams in the additional table part of the evaluation process.

Reminder:  From among the teams that are not automatic qualifiers, the Committee will pick 33 at large participants.

#1 Seeds (Candidate Pool #1 through #7)

The table says Florida State, Notre Dame, and UCLA are clear #1 seeds.  Duke and Penn State are not #1 seeds.  Alabama and North Carolina are candidates for the last #1 seed slot.


The tiebreakers in the second tables I am showing come from a study of which factors have been the most effective over the years at matching Committee decisions.  The tiebreaker factors are specific to the particular decision the Committee is making.  The table says Alabama gets the fourth #1 seed.

#2 Seeds (Candidate Pool #1 through #14)


Taking into account the already identified #1 seeds, North Carolina, Duke, and Stanford are clear #2 seeds.  Arkansas, Pittsburgh, and Harvard are not #2 seeds.  The remaining candidates for the open slot are Penn State, St. Louis, Virginia, and South Carolina.


The table says Virginia gets the fourth #2 seed.

#3 Seeds (Candidate Pool #1 through #23)


The table says Pittsburgh is a clear #3 seed.  Although I could have included South Carolina and Michigan State, I decided to put them into the tiebreaker group along with Penn State, St. Louis, Southern California, and Arkansas.


The table says St Louis, Penn State, and Michigan State get the open #3 seeds.  As an alternative, South Carolina could replace Penn State.

#4 Seeds (Candidate Pool #1 through #26)


Here, I treat Arkansas and South Carolina as clear #4 seeds.  Here is the table for candidates for the two additional #4s:


The table says Southern California and Georgetown get #4 seeds.

Unseeded Automatic Qualifiers

Here are the unseeded automatic qualifiers:


Unseeded At Large Selections (Candidate Pool #1 through #57)


In the table, the teams from Clemson through UCF are at large selections, as are Texas, LSU, Arizona State, California, Mississippi State, and Arizona.  This leaves seven at large positions still open.  The candidates to fill them are the remaining teams in the table down through Wisconsin.


The table says teams 1 through 7 on the list get at large positions.

#5 Through #8 Seeds (Candidate Pool #1 through #51)

I set #51 as the outside edge for these new seeds since no team ranked poorer than #51 has hosted a first round game since 2010 when the NCAA started having only one round on the first weekend of the tournament.  Because identifying Committee patterns for these seeds is speculative, I will simply let the following table speak for itself.  It is based on the assumption, which may not be a good one, that the Committee will select these seeds following the same pattern as fits its past home team awards for unseeded teams.


Summary

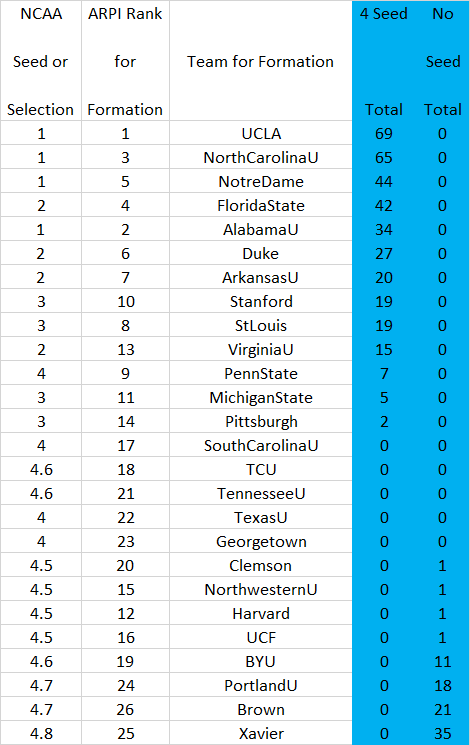
The following table summarizes the above information.  The #1 through #4 seeds are 1 through 4 in the left hand column.  The #5 through #8 seeds are 4.5, 4.6, 4.7, and 4.8, respectively.  The unseeded automatic qualifiers are 5.  The unseeded at large selections are 6.  Teams in the bubble but not selected are 7.


Monday, October 31, 2022

EVALUATION OF TEAMS FOR NCAA TOURNAMENT PURPOSES BASED ON ACTUAL RESULTS OF GAMES THROUGH OCTOBER 30 AND SIMULATED RESULTS OF FUTURE GAMES

Below are tables showing simulated seed and at large selection candidate groups based on the actual results of games played through October 30 and simulated results of games not yet played.

For the candidate groups for seeds and at large selections, each table shows how many historic patterns each team meets indicating that the team will or will not get a positive decision from the Committee.  In addition, I have indicated potential Committee decisions based on the patterns.  If there are positions open for which there are not clear seeds or at large selections, an additional table shows a potential basis for filling those positions.  Each set of tables simply reflects Committee decision patterns from 2007 to the present.

In addition to the four pods of #1 through #4 seeds, the Committee this year will create four pods of #5 through #8 seeds.  The Committee has not done this before, so there are no directly applicable decision patterns to apply to the data.  Since 2010, however, the Committee each year has had 16 first round games involving unseeded opponents.  In those games, it appears the Committee has awarded home field to the team it concluded had performed better over the course of the season.  Since this is as good as we will get until the Committee actually has seeded four new pods, I have used the Committee patterns for selecting home teams for those games as a basis for projecting teams to be in the #17 through #32 seed range that will fill the four new pods.  I will not go into detail here, but will say that for the new seed pods I have used a method similar to what I historically have used for projecting Committee seeds and at large selections.  In general, my caution is to take these projections with a very big grain of salt.

To be clear:  All of the seeds and at large selections shown below are based on the assumption that all teams, through the end of the season, will perform in accord with their current ARPI ratings as adjusted for game locations.  In addition, they are based on the assumption the Committee will follow its historic patterns, which may not happen.

Reminder:  From among the teams that are not automatic qualifiers, the Committee will pick 33 at large participants.

#1 Seeds (Candidate Pool #1 through #7)


In the table, UCLA and North Carolina are clear #1 seeds and Duke and Arkansas clearly are not.  This leaves Alabama, Florida State, and Notre Dame to fill the remaining #1 seed slots.  Although it is possible Florida State also is a clear #1 seed, I decided to include it in the "tiebreaker" evaluation for #1 seeds:


This says that Alabama gets a #1 seed.  On the other hand, Florida State and Notre Dame are tied.  I have assigned Notre Dame the last #1 seed, simply on the basis of its regular season head-to-head win over Florida State.

#2 Seeds (Candidate Pool #1 through #14)


In the table, Florida State and Duke are clear #2 seeds.  The candidates for the other two slots are Stanford, St Louis, Arkansas, and Virginia.  Here is the tiebreaker table for those teams:


Based on the table, Arkansas and Virginia get the open #2 seed slots.

#3 Seeds (Candidate Pool #1 through #23)


Based on the table, Stanford, Pittsburgh, and Michigan State are #3 seeds.  St Louis, Penn State, and South Carolina are candidates for the last #3 seed.


According to the table, St Louis gets the last #3 seed slot.

#4 Seeds (Candidate Pool #1 through #26)


Based on the table, Penn State is a clear #4 seed.  The candidates for the remaining three slots are South Carolina, TCU, Tennessee, Texas, and Georgetown.


According to the table, South Carolina, Texas, and Georgetown get the three open #4 seed slots.

#5 - #8 Seeds (Candidate Pool #1 through #51)

Using a method similar to what you see above, here are the new seed pods, designated 4.5 through 4.8:


These teams all would host first round games and would be placed in the bracket in accord with their seeds.

At Large Selections (Candidate Pool #1 through #57)


In the table, the seeds are marked #1 through #4.8.  The unseeded automatic qualifiers are #5.  Mississippi State and Georgia are clear at large selections.  This leaves 10 at large slots to fill.  Oklahoma State, Fairfield, and Dayton clearly are not at large selections.  The other teams, from Virginia Tech down, are candidates for the 10 open slots.


In the table, teams with tiebreaker ranks #1 through #10 get at large selections.  Teams 11 through 14 do not.  In the long table above this one, the teams getting the 10 at large selections are marked #6 and the candidates not getting at large selections are #7.

Automatic Qualifiers


CURRENT ACTUAL RPI RATINGS FOR GAMES THROUGH OCTOBER 30

Use the following link for access to an Excel workbook with actual RPI ratings and ranks and other data for teams based on games through October 30, 2022: RPI Report 10.30.22. On the left of the RPI Report sheet, there are five color coded columns.  These columns are based on the seasons from 2007 to the present (excluding the 2020 Covid-constrained season).  They show the rank ranges as of this stage of the season from which #1 through #4 seeds have come.  They also show the at large bubble range and that teams ranked #28 or better as of this stage of the season always have gotten at large selections.

I have included some new columns this week:

1.  In Column J I added team ranks as contributors to their opponents’ strengths of schedule.  This is right next to Column I, which is team RPI ranks.  I have put these columns next to each other to highlight a major problem with the RPI formula:  A team’s RPI rank can be very different than its strength of schedule contributor rank.

2.  In Column L I added team Balanced  RPI Ranks.  These are ranks from a variation of the RPI formula I developed.  The variation (1) effectively eliminates the discrepancy between team RPI ranks and their strength of schedule contributor ranks and (2) makes other revisions so that conferences’ teams, in non-conference games, and geographic regions’ teams, in out-of-region games, perform in accord with their ratings.  This latter change effectively eliminates the RPI’s discrimination against teams from stronger conferences and regions.

To give a sense of the seriousness of the problems that the Balanced RPI corrects, here are the pertinent columns from the linked workbook: