Wednesday, February 26, 2025

2025 ARTICLE 3: THE NCAA RPI AND ITS EFFECT ON NCAA TOURNAMENT AT LARGE SELECTIONS

In my first two 2025 articles, I showed the NCAA RPI's defects and how they cause the RPI to discriminate against teams from some conferences and regions and in favor of teams from others.  In this post, I discuss how determinative the NCAA RPI is in the NCAA Tournament at large participant selection process.

Suppose the NCAA were to award at large NCAA Tournament positions to teams based strictly on their NCAA RPI ranks.  How much difference would it make from having the Women's Soccer Committee make the at large selections?  In other words, how many changes would there be from the Committee's awards?  Before reading further, as a test of your own sense of the NCAA RPI's importance in the at large selection process, write down what you think the average number of changes would be per year if the NCAA simply made at large selections based on teams' NCAA RPI ranks.  Later in this article, you'll be able to compare your guess to the actual number.

NCAA Tournament At Large Selection Factors

The NCAA requires the Committee to consider certain factors when making its NCAA Tournament at large selections.  As those of you who follow my work know, I have converted those factors into a series of individual factors and also have paired them to create an additional series of paired factors in which each individual factor has a 50% weight.  Altogether, this produces a series of 118 factors.  Some of the NCAA's individual factors have numerical scoring systems -- for example, the NCAA RPI and NCAA RPI Ranks -- and some do not -- for example, Head to Head Results.  For those factors that do not have NCAA-created scoring systems, I have created scoring systems.

It is possible, by comparing the teams to which the Committee has given at large positions to teams' scores for a factor, to see how close the match-up is between the Committee's at large selections and the factor scores.  The following table shows the factors that best match the Committee's at large selections over the 17 years from 2007 through 2024 (excluding Covid-affected 2020):


As you can see, the Committee's at large selections match teams' NCAA RPI ranks 92.6% of the time.  The Committee has "overruled" the NCAA RPI 42 times (568-526) over the 17 year data period.  The following table shows how the Committee overrules have played out over the years:


As the table shows, over the years, the Committee's selections have differed from the NCAA RPI ranks by from 1 to 4 positions.  The average difference has been 2.47 positions per year.  (This is the answer to the question at the top of this article.)  The median has been 2.  A way to think about this is that on average all the Committee's work has resulted in a change of only 2 to 3 teams per year from what the at large selections would have been if the NCAA RPI made the selections.  This suggests that no matter what the Committee members may think, the NCAA RPI mostly controls the at large selection process, with the Committee's work making differences only at the fringes.

NCAA Tournament At Large Factor Standards
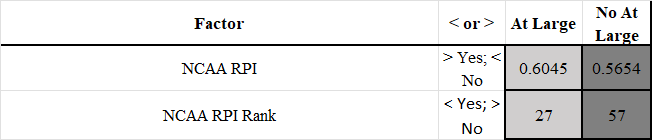
For each of the factors, it is possible to use the 17 years' data to identify what I call "yes" --or "In" -- and "no" -- or "Out" -- standards.  For an "In" standard, any team that has done better than that standard over the 17 year data period always has gotten an at large selection.  Conversely, any team that has done more poorly than an "Out" standard never has gotten an at large selection.  The following table shows the standards for the NCAA RPI Ratings and NCAA RPI Ranks:


In the table, the At Large column has the "In" standards and the No At Large column the "Out" standards.  Thus teams with NCAA RPI ratings better than 0.6045 always have gotten at large selections and teams with ratings poorer than 0.5654 never have gotten selections.  Likewise teams with NCAA RPI ranks better than 27 always have gotten at large selections and teams with ranks poorer than 57 never have.

It is possible to match up teams' end-of-season scores for all of the factors with the factor standards to produce a table like the following one for the 2024 season.  There is an explanation following the table.


The table includes all NCAA RPI Top 57 teams that were not conference champion Automatic Qualifiers.  It is limited to the Top 57 since no team ranked poorer than #57 has ever gotten an at large selection.

NCAA Seed or Selection: This column shows the Committee decision for each team:

 1, 2, 3, and 4 are for 1 through 4 seeds

4.5, 4.6, 4.7, and 4.8 are for 5 through 8 seeds

6 is for unseeded teams that got at large selections

7 is for unseeded teams that did not get at large selections

8 is for teams disqualified from at large selection due to winning percentages belows 0.500

Green is for at large selections and red is for not getting at large selections.

NCAA RPI Rank for Formation:  This is teams' NCAA RPI ranks.

At Large Status Based on Standards:  This column is based on the two grey columns on the right.  The first grey column shows the number of at large "In" factor standards a team has met and the second shows the number of at large "Out" standards for the team.  In 2024, the Tournament had 34 at large openings.  Counting down the "In" and "Out" columns, there were 31 teams that met at least 1 "In" standard and 0 "Out" standards.  In the At Large Status Based on Standards column, these teams are marked "In" and color coded green.  This means the standards identified 31 teams to get at large selections, leaving 3 additional openings to fill.  Counting down further, there were 5 teams that met 0 "In" and 0 "Out" standards.  This means those teams could not be definitively ruled 'In" but also could not be definitively ruled "Out."   This means those 5 teams should be "Candidates" for the 3 remaining openings.  They are marked "Candidate" and color coded yellow.  And counting down further are teams that met 0 "In" standards and at least 1 "No" standard.  This means the standards identified those teams as not getting at large selections.  They are marked "Out" and color coded red.

Supplementing the NCAA Tournament At Large Factor Standards with a Tiebreaker

If you look at the first table in this article, you will see that the NCAA RPI Rank and Top 50 Results Rank paired factor is the best individual indicator of which teams will get at large selections. After applying the factor standards method described above, it is possible to use Candidate teams' scores for this factor as a "tiebreaker" to decide which of those teams should fill any remaining at large openings.

The following table adds use of this tiebreaker to the factor standards method for the 2024 season:


In the table, the "NCAA RPI Rank and Top 50 Results Rank As At Large Tiebreaker" column shows teams' scores for that factor,  The lower the score, the better.  In the At Large Status Based on Standards and Tiebreaker Combined column, the "In" green cells are for teams that get at large selections based on the Standards plus those teams from the Candidates that get at large selections based on the Tiebreaker.  If you compare these to the actual NCAA Seeds or Selections on the left, you will see that the Standards and Tiebreaker Combined at large selections match the actual selections for all but 1 at large position.

In relation to the power of the RPI in directing Committee decisions, it is important to note that the Tiebreaker is based on teams' NCAA RPI Ranks and their ranks based on their Top 50 Results.  Teams' Top 50 Results scores come from a scoring system I developed based on my observations of Committee decisions.  The scoring system awards points based on good results -- wins and ties -- against opponents ranked in the NCAA RPI Top 50, with the awards depending on the ranks of the opponents and heavily slanted towards good results against very highly ranked opponents.  Since the Top 50 Results scores are based on opponents' NCAA RPI ranks, even this part of the Tiebreaker is NCAA RPI dependent.

The following table adds to the preceding tables an At Large Status Based on NCAA RPI Rank column to give an overall picture of how the different "selection methods" compare -- the Committee method, the NCAA RPI rank method, and the Standards and Tiebreaker Combined method.


 Summary Data

The following table shows a summary of the data for each year:


 In this table, I find the color coded information at the bottom in the High, Low, Average, and Median rows most informative.  The information in the green column shows the difference between what the Committee has decided on at large selections over the years as compared to what the decisions would have been if the NCAA simply used the NCAA RPI.  The information in the salmon column shows what the difference would have been -- about 1 1/3 positions per year, with a median of 1 -- if the NCAA used a more refined method than the NCAA RPI, but one stilll very heavily influenced by the NCAA RPI.

Altogether, the numbers suggest that the NCAA RPI exerts an almost determinative influence on which teams get NCAA Tournament at large positions.  This does not mean the Committee members think that is the case, they may believe that they are able to value other factors as much as or even more than the NCAA RPI.  But whatever the individual members think, the numbers suggest that the Committee as a whole is largely under the thumb of the NCAA RPI.

Given the fundamental flaws of the NCAA RPI, as discussed in 2025 Articles 1 and 2, the near-determinative power of the NCAA RPI in the NCAA Tournament at large selection process is particularly disturbing.

Tuesday, February 25, 2025

2025 ARTICLE 2: GRADING THE NCAA RPI AS A RATING SYSTEM, 2025 UPDATE

INTRODUCTION

My "correlator" program evaluates rating systems for Division I women's soccer.  The correlator uses the combined games data from seasons beginning with 2010.  I update the correlator's evaluations each year by adding the just-completed year's data..  The correlator data base now includes just short of 44,000 games.

I have completed the evaluation updates for the NCAA RPI and for the Balanced RPI following the 2024 season.

For games data from 2010 and after, for both rating systems, I use game results as though the "no overtime" rule had been in effect the entire time. 

For 2010 and after, for both rating systems I use ratings computed as though the 2024 NCAA decision, to count ties as 1/3 rather than 1/2 of a win for RPI formula Winning Percentage purposes, had been in effect the entire time. 

For 2010 and after, for the NCAA RPI, I use ratings computed as though the 2024 NCAA decision altering the RPI bonus and penalty adjustment structure had been in effect the entire time.  The Balanced RPI does not have a bonus/penalty structure.

Thus the evaluations use the entire data base to show how well the current NCAA RPI formula performs, as compared to the Balanced RPI.

Why use the Balanced RPI for the comparison?  It uses the same data as the NCAA RPI; and the NCAA could implement it as a replacement for the NCAA RPI simply by adjusting and adding to its current NCAA RPI computation program.  Thus it is a realistic measuring stick against which to evaluate the NCAA RPI.  Typically but not always, the Balanced RPI's rankings are similar to Massey's.

DISCUSSION

Ability of Teams to "Trick" the System Through Smart Scheduling


In 2025 Article 1, I showed that the NCAA RPI has significant differences between a team's NCAA RPI rank and its rank within the NCAA RPI formula as a Strength of Schedule Contributor to its opponents' ratings.  The above table shows this for the NCAA RPI as compared to the Balanced RPI.  The first three columns with numbers are self-evident.  The five columns on the right show, for each rating system, the percent of teams for which the NCAA RPI rank versus the RPI formula's SoS Contributor rank difference is 5, 10, 15, 20, and 25 or fewer positions.

As you can see from the entire table, for the Balanced RPI, teams' full ranks are either identical or almost identical to their SoS Contributor ranks.  For the NCAA RPI, the differences are big.

For the NCAA RPI, beccause of these differences, teams can "trick" the ratings and ranks through smart scheduling.  The following table shows this:


This table is from the 2024 season, so it shows a "real life" example.  Although the first two color coded columns refer to the ARPI Rank "2015 BPs," their numbers actually are for the 2024 version of the NCAA RPI.  And the two color coded columns on the right are for the Balanced RPI.  I've included the Massey ranks so you can use them as a "credibility" check for the Balanced RPI ranks.

If I am a coach looking for a non-conference opponent with my NCAA Tournament prospects in mind, I might think that a game against any of the four teams would have an about equal effect on my likely result, my NCAA RPI rank, and my NCAA Tournament prospects.  I would be wrong:

It is true that the NCAA RPI ranks will be telling the Women's Soccer Committee that the four teams are about equal.

In terms of the teams' true strength, however, Liberty and James Madison are considerably weaker than the NCAA RPI says and California is significantly stronger.  Both the Balanced RPI and Massey indicate that the true order of strength of the teams is Liberty as the weakest, followed by James Madison, then Oklahoma, then California as the strongest.

In addition, looking at the NCAA RPI formula's ranks of the teams as SoS Contributors to their opponents' NCAA RPI ratings, the order of contributions is Liberty as the best contributor, followed by James Madison, then California, then Oklahoma. 

Thus Liberty is the best team as an opponent.  The NCAA ranks tell the Committee it is equal in strength to the other three teams.  In terms of actual strength (Massey and the Balanced RPI), however, it is the weakest of the teams by a good margin.  And it will make the best contribution under the NCAA RPI formula to its opponents' Strengths of Schedule by a good margin.  And, by a comparable analysis, James Madison is second best as an opponent.  Thus by scheduling Liberty or James Madison and avoiding Oklahoma and California I am able to "trick" the system and the Committee into thinking I'm better than I really am.

In grading the NCAA RPI as a rating system, this ability of teams to "trick" the system through smart non-conference scheduling is a big "fail."  And, as the Balanced RPI shows, it is an unnecessary fail.

Ability of the System to Rate Teams from a Conference Fairly in Relation to Teams from Other Conferences


This chart, based on the NCAA RPI, shows the relationship between conferences' ratings and how their teams perform in relation to their ratings.  The conferences are arranged from left to right in order of strength: The conference with the best average rating is on the left and with the poorest on the right.  For each conference, the correlator determines what its teams' combined winning percentage in non-conference games should be based on the rating differences (as adjusted for home field advantage) between the teams and their opponents and also determines what their actual winning percentage is.  The axis on the left shows the differences between these two numbers.  For example, the conferences with the best rating, on the left, wins roughly 5% more games than it should according to its ratings.  The black line is a trend line that shows the relationship between conferencce strength and conference performance relative to ratings.  The formula on the chart shows what the expected difference is at any point on the conference strength line.

As you can see, stronger conferences perform better than their ratings say they should and weaker conferences perform more poorly.  In other words, stronger conferences are underrated and weaker conferences are overrated.  If you have read 2025 Article1, this is exactly as expected.


This table comes from the data underlying the above chart and a comparable chart for the Balanced RPI (see the chart, below).  The first three columns with numbers are based on individual conferences' performance in relation to their ratings.  In the Conferences Actual Less Likely Winning Percentage, High column is the performance of the conference that most outperforms its rating: The NCAA RPI's winning percentage for this conference is 4.9% better than it should be according to its rating.  In the Conference Less Likely Winning Percentage, Low column is the conference that most underperforms its rating: for the NCAA RPI by -7.1%.  The Conference Actual Less Likely Winning Percentage, Spread column is the difference between these two numbers: for the NCAA RPI 12.0%.  This last number is one measure of how good or poor the rating system is at rating conferences' teams in relation to teams from other conferences.

The fourth column with numbers, Conferences Actual Less Likely Winning Percentage, Over and Under Total, is the total amount by which all conferences' teams perform better or poorer than what their performance should be based on their ratings: for the NCAA RPI 64.6%.  This is another measure of how good or poor a rating system is at rating conferences' teams.

The fifth through seventh columns are for discrimination in relation to conference strength and come from the trend line formula in the conferences chart.  The Conferences Actual Less Likely Winning Percentage Trend Related to Conference Average Rating, High is what the trend line says is the "expected"performance for the strongest conference on the left of the chart: for the NCAA RPI 4.3% better than it should be according to its rating.  And the Conference Actual Less Likely Winning Percentage Trend Related to Conference Average Rating, Low is for the epected performance of the weakest conference on the right: for the NCAA RPI 5.6% poorer than it should be.  The Actual Less Likely Winning Percentage Trend Related to Conference Average Rating, Spread is the difference between the High and the Low; for the NCAA RPI 9.9%.  This is a measure of the NCAA RPI's discrimination in relation to conference strength.

If you compare the numbers for the Balanced RPI to those for the NCAA RPI, you can see that (1) the NCAA RPI performs significantly more poorly than the Balanced RPI at rating teams from a confernce in relation to teams from other conferences and (2) the NCAA RPI discriminates against stronger and in favor of weaker conferences whereas the Balanced RPI has virtually no discrimination in relation to conferencee strength.

The following chart confirms that the Balanced RPI does not discriminate in relation to conference strength:


Ability of the System to Rate Teams from a Geographic Region Fairly in Relation to Teams from Other Geographic Regions

I divide teams among four geographic regions based on where the majority or plurality of their opponents are located: Middle, North, South, and West.


This chart, for the NCAA RPI, is lilke the first "conferences" chart above, but is for the geographic regions.  The regions are in order of average NCAA RPI strength from the strongest on the left to the weakest on the right.  Although the trend line suggests that the NCAA RPI discriminates against  stronger and in favor of weaker regions, I do not find the chart particularly persuasive and the R squared number on the chart supports this.  The R squared number is a measure of how well the data match up with the trend line.  An R squared number of 1 is a perfect match and 0 is no match at all.  The R squared number on the chart of 0.4 is a relatively weak match.  Thus although the chart may indicate some discrimination against stronger and in favor of weaker regions, region strength may not be the main driver of the region performance differences.

Here is a second chart for regions, but rather than relating the regions' performance to their strength it relates performance to their levels of internal parity as measured by the proportion of intra-regional ties.


This chart suggests that the higher the proportion of a region's intra-regional games that are ties and, by logical extension, the higher the level of parity within the region, the more its teams' actual performance in games against teams from other regions exceeds their expected performance based on their ratings.  And, as you can see from the R squared value, this trend line is much more representative of the data than for the chart based on region strength.  What this suggests is that the NCAA RPI has a problem properly rating teams from a region in relation to teams from other regions when the regions have different levels of intra-region parity.  It discriminates against regions with high intra-region parity and in favor of regions with less parity.  If you consider the description in 2025 Article 1 of how the NCAA constructs the RPI, this is what one would expect: The NCAA RPI rewards teams that play opponents with good winning percentages, largely without reference to the strength of those opponents' opponents.  If a region has a low level of parity, there are many intra-region opponents to choose from that will have good winning percentages.  But if a region has a high level of parity, there are fewer opponents to choose from that will have good winning percentages.

For further confirmation that one would expect the NCAA RPI to underrate regions with higher levels of parity and overrate regions with lower levels, see the "Why Does the NCAA RPI Have a Regions Problem?" section of the RPI: Regional Issues page at the RPI for Division I Women's Soccer website.


This table for regions is like the left-hand side of the table above for conferences.  As you can see it shows that the NCAA RPI does a poor job of rating teams from a region in relation to teams from the other regions, when compared to the job the Balanced RPI does.


This second table is like the right-hand side of the conferences table.  The first three columns with numbers are for the trend in relation to the proportion of ties -- parity -- within the regions and the next three columns are for the trend in relation to region strength.  As you can see, in relation to both parity and strength, the NCAA RPI has significant discrimination as compared to the Balanced RPI.

Here are the charts for the Balanced RPI, which you can compare to the above charts for the NCAA RPI:


Ability of the System to Produce Ratings That Will Match Overall Game Results


This table is a look at the simple question: How often does the better rated team, after adjustment for home field advantage, win, tie, and lose?  As you can see, compared to the Balanced RPI, the NCAA RPI's better rated team wins 0.6% fewer times.  This is not a big difference, since an 0.1% difference represents about 3 games per year, so 0.6% represents 18 games per year out of about 3,000 games.  Nevertheless, the Balanced RPI performs better.


This is like the preceding table except that it covers only games that involve at least one team in the rating system's top 60.  Since the NCAA RPI and Balanced RPI have different Top 60 teams, their Top 60 teams have different numbers of ties.  This makes it preferable to compare the systems based on how their ratings match with results in games that are not ties.  As you can see, after discounting ties, the Balanced RPI is consistent with results 0.2% of the time more than the NCAA RPI.  Here too, this is not a big difference since an 0.1% difference represents 1 game per year out of about 1,000 games involving at least one Top 60 team.

What this shows is that the difference between how the NCAA RPI and Balanced RPI perform is not in how consistent their ratings are with game results overall.  Both have similar error rates, with the Balanced RPI performing slightly better.

The difference is in where the systems' ratings miss matching with actual results.  In an ideal system, all "misses" are random, so that the system does not favor or disfavor any identifiable group of teams.  The Balanced RPI appears to accomplish this and shows, as a measuring stick, what one reasonably can expect a rating system to do.  As the conferences and geographic regions analyses show, the NCAA RPI does not accomplish this.

CONCLUSION

Based on the ability of schedulers to "trick" the NCAA RPI and on its conference- and region-based discrimination as compared to what the Balanced RPI shows is achievable, the NCAA RPI continues to get a failing grade as a rating system for Division I women's soccer.

Wednesday, January 8, 2025

2025 ARTICLE 1: NCAA RPI TEAM RANKS AS COMPARED TO NCAA RPI RANKS OF TEAMS AS CONTRIBUTORS TO OPPONENTS' STRENGTHS OF SCHEDULE

 INTRODUCTION

The NCAA RPI formula assigns values to:

1.  A Team's Winning Percentage (WP); and

2.  A Team's Strength of Schedule (SoS).

The formula is set so that each of these values accounts for 50%, in effective weight, of the Team's NCAA RPI rating.  The NCAA publicly acknowledges these effective weights.

The NCAA SoS value consists of two elements:

1.  The average of a Team's Opponents' Winning Percntages (OWP); and

2.  The average of a Team's Opponents' Opponents' Winning Percentages (OOWP).

The formula is set so that OWP accounts for 80% and OOWP for 20% of SoS, in effective weights.  The NCAA does not publicly acknowledge these effective weights.

Thus overall, the NCAA RPI value for a team consists of, in effective weights:

Winning Percentage 50%

Average of Opponents' Winning Percentages 40%

Average of Opponents' Opponents' Winning Percentages 10%

This compares to the NCAA RPI SoS contributor value for a team which consists of, in effective weights:

 Winning Percentage 80%

Opponents' Winning Percentage 20%

Because of the differences in these calculation methods, a team's NCAA RPI rating and rank can be and often are very different than its NCAA RPI SoS Contributor value and rank.  The NCAA does not publish teams'  SoS Contributor values and ranks and does not discuss that they are different than teams' NCAA RPI ratings and ranks.

How different are these two sets of numbers?  For the formula the NCAA currently uses:

The average difference between a team's NCAA RPI rank and its NCAA RPI SoS Contributor rank is 31.3 positions.

The median difference is 24 positions.

The maximum difference, since 2010, is 177 positions.

EFFECT OF THE NCAA RPI v SoS VALUE DIFFERENCES ON CONFERENCES 

In the Team Histories and Simulated 2025 Balanced RPI Ranks workbook, I have calculated for each team, for each year since 2010, the difference between the average NCAA RPI rank of its conference opponents and the average NCAA RPI SoS Contributor rank of those same opponents.  I then have calculated the average of those numbers over the period from 2010 through 2024.  I have done the same for non-conference opponents.

To show the effect of the NCAA RPI v SoS Value differences on conferences, I will start with the ACC as an example.  Here is a chart for Clemson, for whom the effect is typical for an ACC team.  Scroll to the right, if necessary, to see the entire chart:


In the chart, the blue lines are for Clemson's ACC conference opponents.  The dark blue line shows its conference opponents' average NCAA RPI ranks, year by year.  The light blue line shows their average NCAA formula ranks as SoS contributors.  As the chart shows, Clemson's ACC opponents' ranks as SoS contributors are consistently and significantly poorer than their actual NCAA RPI ranks, to the tune of 39 positions poorer on average.

The red and orange lines are for Clemson's non-conference opponents.  There is more variability here since Clemson's non-conference schedule can change significantly from year to year.  Nevertheless, in general Clemson's non-conference opponents' ranks as SoS contributors are poorer than their actual NCAA RPI ranks, to the tune of 16 positions on average.

The net effect on Clemson is that the NCAA RPI formula seriously underrates its conference opponents and also underrates its non-conference opponents.  This causes the formula as a whole to underrate Clemson.

Here is what the numbers show for the Atlantic Coast Conference as a whole.  (SMU, at the bottom of the table, is new to the conference and from a significantly weaker conferece and thus is not representative of the ACC's teams.  Stanford and California, at the top, are new but from the relatively equivalent Pac 12 and are relatively representative for the ACC.)

If you look at the third column of numbers for the teams, you will get a clear picture of how the NCAA RPI treats the ACC teams for SoS Contributor purposes.  Each team's average conference opponents' SoS Contribution to the team's NCAA RPI is 35 to 45 positions poorer than it should be according to the full NCAA RPI.  In addition, all of the teams' non-conference opponents' SoS Contributions are poorer than they should be, though to a lesser and more varying degree.

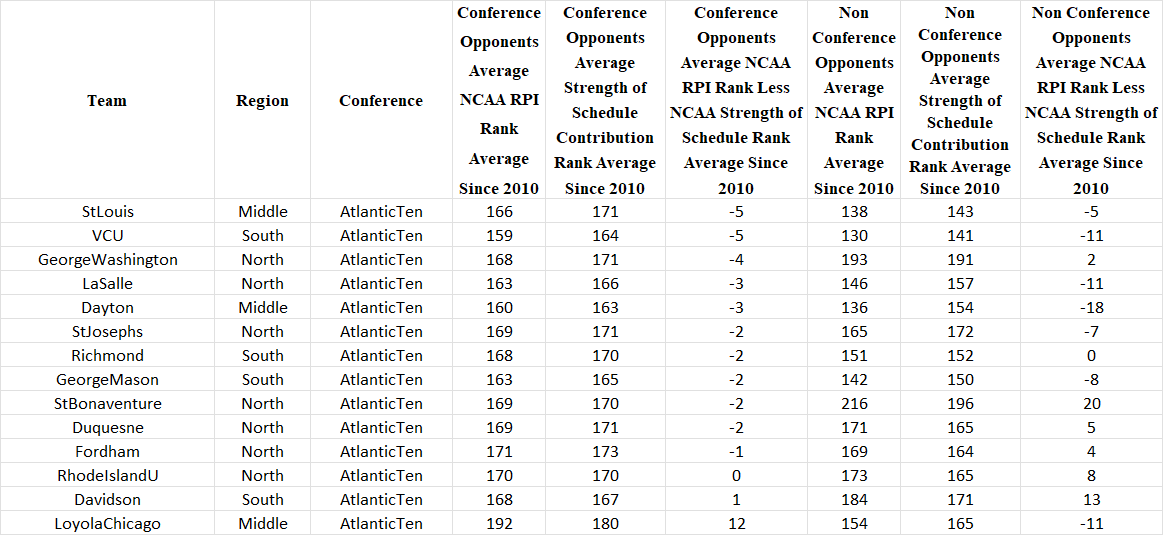
Next, I will show the information for a conference in the middle where the differences between teams' conference opponents' NCAA RPI ranks and NCAA formula ranks as SoS contributors are similar.  The Atlantic 10 is a good example, with Richmond as a representative team:


As you can see, for Richmond, its conference opponents' NCAA RPI ranks and their NCAA formula RPI SoS contributor ranks are quite similar.  On average, its conference opponents' NCAA formula SoS contributor ranks are only 2 positions poorer than their NCAA RPI ranks.  Although for Richmond's non-conference opponents there is more variability from year to year, overall on average there is no difference between the opponents' NCAA formula SoS contributor ranks and the NCAA RPI ranks.

Here is the table for the Atlantic 10 as a whole:


As you can see, for the Atlantic 10, the NCAA RPI formula gets their ratings about right.  (Note: Loyola Chicago joined the Atlantic 10 in 2022 and its numbers are not representative for the Atlantic 10.)

However, since the RPI significantly underrates teams from conferences at the level of the ACC, the NCAA RPI cannot get the Atlantic 10 rankings right, since teams from conferences at the level of the ACC might pass them in the rankings if properly rated.

And, here is information for a conference at the bottom of the spectrum, where teams' conference opponents' NCAA formula SoS contributor ranks are significantly better than their NCAA RPI ranks.  The Southland is the example, with Northwestern State as a representative team:


You can see that Northwestern State's conference opponents' NCAA formula SoS contributor ranks are better than their NCAA RPI ranks, on average 25 positions better.  Likewise its non-conference opponents' NCAA formula SoS contributor ranks are better, although less so, on average 13 positions better.

Here is the table for the Southland as a whole:


As you can see, the NCAA formula consistently over-ranks the Southland teams as NCAA formula SoS contributors and thus consistently overrates its teams.  For a conference like this, where it matters from an NCAA Tournament perspective, is if a team from the conference has an unusually good year and achieves an NCAA RPI rank that puts it in consideration for an NCAA Tournament at large selection or even for a seed.  In that case, the team will be over-ranked and thus may have bumped out of consideration a team from a strong conference, especially since teams from strong conferences are underrated.

TABLE OF ALL TEAMS, BY CONFERENCE

Below is a table of all the teams, arranged by conference so you can see the full NCAA RPI to NCAA RPI SoS rankings contrast for each conference.  It provides as clear and stark a demonstration as possible of the NCAA RPI's problem rating teams from a conference in relation to teams from other conferences.  The way the NCAA RPI is constructed, as discussed above in the Introduction, it can't do this properly.

When is this a problem from an NCAA Tournament perspective?  It is a problem whenever teams from under-ranked and over-ranked conferences are in the same NCAA RPI rank area for seeding or for at large selections.  And, it is a problem when teams from under-ranked conferences are outside the historic range for consideration for at large selections but really should be inside the range; and when teams from over-ranked conferences are inside the historic range for consideration for at large selections but should be outside the range.  Does the NCAA give the Women's Soccer Committee information about the NCAA RPI rank versus NCAA formula SoS Contributor rank differences so that the Committee can adjust its evaulations of teams to take the differences into account?  No.  Even if the NCAA were to give the Committee that information, would Committee members have the sophistication to properly take the differences into account?  Unlikely.  The solution?  Stop using the NCAA RPI and replace it with a better system.


Sunday, November 10, 2024

2024 ARTICLE 15: FINAL NCAA TOURNAMENT PREDICTIONS

[NOTE: The tables below are different than the ones I originally published on November 10, 2024.  This is because I discovered a programming error in the Excel workbook I use to do my predictions of what the Committee will decide on NCAA Tournament seeds and at large selections.  The error involved the calculations of the RPI bonuses and penalties for good and poor results.  The error now is fixed.  The tables now are as of November 11, 2024.]

Here is what my computer comes up with as NCAA Tournament seeds and at large selections, and candidate teams not getting at large selections, if the Committee follows its historic patterns.  Below the table, I havea list of the final at large teams "in" and "out."  The system has Liberty and Boise State getting at large positions rather than California and Washington.  I would not be surprised to see Liberty and Boise State out and California and Washington in.

In the NCAA Seed or Selection column, the seeds 4.5, 4.6, 4.7, and 4.8 are the 5, 6, 7, and 8 seeds.  The 5s are unseeded Automatic Qualifiers.  The 6s are unseeded at large teams.  The 7s are RPI Top 57 teams not getting at large positions.


Tuesday, November 5, 2024

2024 ARTICLE 14: POST-WEEK-12 ACTUAL RATINGS AND UPDATED PREDICTIONS

I am sorry to be late with this week's report, but I had to spend time figuring out why my and the Chris Henderson/All White Kit ratings and ranks did not match the NCAA ratings and ranks published as of November 3.  As it turns out, the culprit is either Duquesne or George Mason, with the wrong outcome for their October 27 game having found its way into the NCAA's RPI data base.  The actual result was a 1-1 tie.  The score in the data base was a 2-1 George Mason win.  This had a ripple effect throughout the ratings and ranks.  The NCAA stats staff became aware of this, corrected it, and as of Tuesday morning published corrected RPI ratings and ranks.

 Current Actual RPI Ratings, Ranks, and Related Information

The following tables show actual RPI ratings and ranks and other information based on games played through Sunday, November 3.  The first table is for teams, the second for conferences, and the third for geographic regions.  Scroll to the right to see all the columns.


Predicted Team RPI and Balanced RPI Ranks, Plus RPI and Balanced RPI Strength of Schedule Contributor Ranks

The following table for teams and the next ones for conferences and regions show predicted end-of-season ranks based on the actual results of games played through November 3 and predicted results of games not yet played, including conference tournament games.  The predicted results of future games are based on teams' actual RPI ratings from games played through November 3.

In the table, ARPI 2015 BPs is ranks using the NCAA's 2024 RPI Formula.  URPI 50 50 SoS Iteration 15 is using the Balanced RPI formula.


Predicted NCAA Tournament Automatic Qualifiers, Disqualified Teams, Seeds, and At Large Selection Status, All for the Top 57 Teams

Below, I show predicted #1 through #8 seeds and at large selections based on the Women's Soccer Committee's historic decision patterns.  With one week of regular season play left to go consisting mostly of conference tournaments, there will be some changes from the predictions.  Nevertheless, we now are getting close to where things will end up.

The first table below is for potential #1 seeds.  The #1 seeds always have come from the teams ranked #1 through 7 in the end-of-season RPI rankings, so the table is limited to the teams predicted to fall in that rank range.  The table is based on applying history-based standards to team scores in relation to a series of factors, all of which are related to the NCAA-specified criteria the Committee is required to use in making at large decisions.  For each factor, there is a standard that says, if a team met this standard historically, the team always has gotten a #1 seed.  I refer to this as a "yes" standard.  For most of the factors, there likewise is a standard that says, if a team met this standard historically, it never has gotten a #1 seed.  This is a "no" standard.  In the table, I have sorted the Top 7 RPI #1 seed teams in order of the number of yes standards they meet and then in order of the number of no standards.


This shows Mississippi State as 1 clear #1 seed.  Duke, North Carolina, and Penn State have profiles the Committee has not seen before (meeting both "yes" and "no" standards), but are possible #1 seeds.  Arkansas, Southern California, and Florida State likewise are possible #1 seeds.  The following table applies the "tiebreaker" for #1 seeds to the "possible" group.  (A "tiebreaker" is a factor that historically has been the best predictor for a particular Committee decision.)


As you can see, Duke, Southern California, and Arkansas score best on the tiebreaker and so join Mississippi State as the predicted #1 seeds.

The candidates for #2 seeds are teams ranked through #14.  With the #1 seeds already assigned, this produces the following table:


This shows North Carolina, Wake Forest, and Florida State as clear #2 seeds.  Penn State has a profile the Committee has not seen before, but is a possitle #2 seed.  There are no other possible #2 seeds.  Given that, North Carolina, Wake Forest, Florida State, and Penn State are predicted #2 seeds.

The candidates for #3 seeds are teams ranked through #23.  With the #1 and 2 seeds already assigned, this produces the following table:


This shows there are no clear #3 seeds.  Notre Dame and Virginia have profiles the Committee has not seen before, but are possible #3 seeds.  Iowa, Georgetown, UCLA, South Carolina, and Michigan State likewise are possible #3 seeds.  The following table applies the "tiebreaker" for #3 seeds to the "possible" group.


As you can see, Iowa, Michigan State, Notre Dame, and UCLA score best on the tiebreaker and so are the predicted #3 seeds.

The candidates for #4 seeds are teams ranked through #26.  With the #1, 2, and 3 seeds already assigned, this produces the following table:


This shows no clear #4 seeds.  Virginia, Stanford, and Utah State have profiles the Committee has not seen before, but are possitle #4 seeds.  Georgetown, South Carolina, Ohio State, and Texas likewise are possible #4 seeds.  The following table applies the "tiebreaker" for #4 seeds to the "possible" group.


As you can see, Stanford, Ohio State, Virginia, and South Carolina score best on the tiebreaker and so are the predicted #4 seeds.

For # 5 through #8 seeds, the candidates are the not already seeded teams ranked #1 through #49.  Although the data are limited since we have had those seeds for only a few years, the best indicator of which teams will get those seeds is a combination of teams' RPI ranks and their Top 60 Head to Head results ranks:


Using this table, the #5 seeds are TCU, Utah State, Georgetown, and St. Louis.  The #6s are Auburn, Texas, Western Michigan, and BYU.  The #7s are Vanderbilt, Kentucky, Minnesota, and Rutgers.  The #8s are Texas Tech, Xavier, Virginia Tech, and Liberty.

For the remaining At Large selections, the candidates run up to RPI #57, producing the following initial table:


In the NCAA Seed or Selection column, the 5s are the unseeded Automatic Qualifiers.

As the table indicates, Oklahoma State, Georgia, Pepperdine, and Wisconsin are clear At Large teams.  This leaves 6 additional spots to fill.  West Virginia and Pittsburgh have profiles the Committee has not seen before and are candidates for those spots.  Tennessee, LSU, Washington, Kansas, and Colorado also are candidates for those spots.  In addition, Massachusetts, Dayton, California, and Connecticut are close, so they may be additional candidates for the open spots if the Committee breaks its historic patterns.  The remaining teams are unlikely: Oklahoma, Rice, and Army.

The following table applies the "tiebreaker" for the last at large candidates and also for the close candidates:


Based on the two above tables, the predicted unseeded at large selections go to Oklahoma State, Georgia, Pepperdine, Wisconsin, West Virginia, Tennessee, Pittsburgh, and Washington and either Massachusetts and Dayton if the Committee breaks with past patterns or LSU and Kansas if the Committee does not.

Based on the above, this produces the final compilation of seeds, Automatic Qualifiers, at large selections, and Top 57 teams not getting at large selections.  In the NCAA Seed or Selection column, in addition to the seeds and at large selections, the 6s are unseeded at large selections, the 6.5s are the "edge of the bubble" group from which 2 teams will get at large positions with the ones getting them depending on whether the Committee breaks with its historic patterns, and the 7s are Top 57 teams not getting at large positions.  And, of course, the Committee could break even more of its historic patterns, so one always must take that possibility into account.


What If the Committee Were Using the Balanced RPI?

If the Committee were using the Balanced RPI, which does not have the NCAA RPI's problem of discrimination in relation to conferences and regions, the following teams would drop out of the RPI Top 57:

Fairfield, AQ, drops from NCAA RPI 39 to Balanced RPI 90; Liberty, AQ, 41 to 68; South Florida, AQ, 42 to 66; Massachusetts, 43 to 62; Dayton, 45 to 60; James Madison (AQ as of 11/3), 52 to 67; Army, 56 to 77; and Rice, 57 to 96.

The following teams would move into the Balanced RPI Top 57:

Arizona, 61 to 40; Loyola Marymount, 80 to 47; Baylor, 65 to 49; UC Davis, 76 to 53; Alabama, 85 to 54; Illinois, 101 to 55; Boston College, 71 to 56; and Nebraska, 111 to 57.

It's worth noting that these shifts primarily are teams from weaker conferences moving out of the Top 57 and teams from stronger conferences moving in.  In addition, no teams from the West geographic region move out of the Top 57 and three from the West region move in.  None of this is surprising given the RPI's discrimination problems.

In terms of actual at large changes, it is likely that Oklahoma State, West Virginia, and one spot from among Kansas, Massachusetts, and Dayton would lose their predicted at large positions and would be replaced by California, Colorado, and Baylor.

Monday, October 28, 2024

2024 ARTICLE 13: POST-WEEK-11 ACTUAL RATINGS AND UPDATED PREDICTIONS

 Current Actual RPI Ratings, Ranks, and Related Information

The following tables show actual RPI ratings and ranks and other information based on games played through Sunday, October 27.  The first table is for teams, the second for conferences, and the third for geographic regions.  Scroll to the right to see all the columns.


Predicted Team RPI and Balanced RPI Ranks, Plus RPI and Balanced RPI Strength of Schedule Contributor Ranks

The following table for teams and the next ones for conferences and regions show predicted end-of-season ranks based on the actual results of games played through October 27 and predicted results of games not yet played, including conference tournament games.  The predicted results of future games are based on teams' actual RPI ratings from games played through October 27.

In the table, ARPI 2015 BPs is ranks using the NCAA's 2024 RPI Formula.  URPI 50 50 SoS Iteration 15 is using the Balanced RPI formula.


Predicted NCAA Tournament Automatic Qualifiers, Disqualified Teams, and At Large Selection Status, All for the Top 57 Teams

Below, I show predicted #1 through #8 seeds and at large selections based on the Women's Soccer Committee's historic decision patterns.  With two weeks of regular season play left to go (including conference tournaments), there will be changes, possibly significant, from the predictions.  Nevertheless, we now are getting closer to where things will end up.

The first table below is for potential #1 seeds.  The #1 seeds always have come from the teams ranked #1 through 7 in the end-of-season RPI rankings, so the table is limited to the teams predicted to fall in that rank range.  The table is based on applying history-based standards to team scores in relation to a series of factors, all of which are related to the NCAA-specified criteria the Committee is required to use in making at large decisions.  For each factor, there is a standard that says, if a team met this standard historically, the team always has gotten a #1 seed.  I refer to this as a "yes" standard.  For most of the factors, there likewise is a standard that says, if a team met this standard historically, it never has gotten a #1 seed.  This is a "no" standard.  In the table, I have sorted the Top 7 RPI #1 seed teams in order of the number of yes standards they meet and then in order of the number of no standards.


This shows North Carolina and Mississippi State as clear #1 seeds.  Duke and Wake Forest have profiles the Committee has not seen before (meeting both "yes" and "no" standards), but are possitle #1 seeds.  Arkansas and Southern California likewise are possible #1 seeds.  The following table applies the "tiebreaker" for #1 seeds to the "possible" group.  (A "tiebreaker" is a factor that historically has been the best predictor for a particular Committee decision.)


As you can see, Duke and Southern California score best on the tiebreaker and so join North Carolina and Mississippi State as the predicted #1 seeds.

The candidates for #2 seeds are teams ranked through #14.  With the #1 seeds already assigned, this produces the following table:


This shows Wake Forest, Arkansas, and Florida State as clear #2 seeds.  Penn State and Stanford have profiles the Committee has not seen before, but are possitle #2 seeds.  Iowa and Michigan State likewise are possible #2 seeds.  The following table applies the "tiebreaker" for #2 seeds to the "possible" group.


As you can see, Iowa scores best on the tiebreaker and so joins Wake Forest, Arkansas, and Florida State as the predicted #2 seeds.

The candidates for #3 seeds are teams ranked through #23.  With the #1 and 2 seeds already assigned, this produces the following table:


This shows Penn State and Stanford as clear #3 seeds.  Notre Dame has a profile the Committee has not seen before, but is a possitle #3 seed.  Michigan State, UCLA, and Georgetown likewise are possible #3 seeds.  The following table applies the "tiebreaker" for #3 seeds to the "possible" group.


As you can see, Michigan State and Notre Dame score best on the tiebreaker and so join Penn State and Stanford as the predicted #3 seeds.

The candidates for #4 seeds are teams ranked through #26.  With the #1, 2, and 3 seeds already assigned, this produces the following table:


This shows no clear #4 seeds.  Virginia and Utah State have profiles the Committee has not seen before, but are possitle #4 seeds.  UCLA, South Carolina, Vanderbilt, Georgetown, TCU, and Auburn likewise are possible #4 seeds.  The following table applies the "tiebreaker" for #4 seeds to the "possible" group.


As you can see, Virginia, UCLA, South Carolina, and Vanderbilt score best on the tiebreaker and so are the predicted #4 seeds.

For # 5 through #8 seeds, the candidates are the not already seeded teams ranked #1 through #49.  Although the data are limited since we have had those seeds for only a few years, the best indicator of which teams will get those seeds is a combination of teams' RPI ranks and their Top 60 Head to Head results ranks:


Using this table, the #5 seeds are TCU, Utah State, Auburn, and Georgetown.  The #6s are Virginia Tech, Minnesota, Ohio State, and Xavier.  The #7s are St. Louis, Kentucky, Western Michigan, and West Virginia.  The #8s are Texas, Liberty, Wisconisn, and Santa Clara.

For the remaining At Large selections, the candidates run up to RPI #57, producing the following initial table:


Here, Oklahoma State, Georgia, Texas Tech, and BYU are clear At Large teams, with 7 additional spots to fill.  Pittsburgh, Buffalo, and Memphis have profiles the Committee has not seen before and are candidates for those spots.  Pepperdine, Rutgers, Washington, and Arizona also are candidates for those spots.  Texas A&M would be a candidate but has a winning percentage below 0.500 due to a predicted conference tournament first round loss and thus is not a candidate,  The remaining teams are not at large selections.  Since there are only 7 eligible candidates to fill the 7 open spots, all of Pittsburgh, Buffalo, Memphis, Pepperdine, Rutgers, Washington, and Arizona fill those spots.

Based on the above, this produces the final compilation of seeds, Automatic Qualifiers, at large selections, and Top 57 teams not getting at large selections.  In the NCAA Seed or Selection column, the seeds are self explanatory, the 5s are unseeded Automatic Qualifiers, the 6s are unseeded at large selections, the 6.5 is disqualified, and the 7s are Top 57 teams not getting at large positions.


What If the Committee Were Using the Balanced RPI?

If the Committee were using the Balanced RPI, which does not have the NCAA RPI's problem of discrimination in relation to conferences and regions, the following teams would drop out of the RPI Top 57:

Fairfield, AQ, drops from RPI rank 37 to Balanced RPI rank 94; Liberty AQ 39 to 68; South Florida AQ 40 to 71; Dayton No At Large 41 to 62; James Madison AQ 44 to 64; Massachusetts No At Large 46 to 70; Columbia AQ 47 to 63; Army No AL 49 to 65; Buffalo Yes At Large 54 to 79; Texas A&M DQ 55 to 66.

The following teams would move into the Balanced RPI Top 57:

California 65 to 35; Colorado 58 to 40; Loyola Marymount 79 to 43; Tennessee 60 to 33; Illinois 98 to 51; UC Davis 80 to 52; Baylor 74 to 53; Connecticut 64 to 54; Kansas 64 to 56; Utah 86 to 57.

It's worth noting that these shifts primarily are teams from weaker conferences moving out of the Top 57 and teams from stronger conferences moving in.  In addition, no teams from the West geographic region move out of the Top 57 and five from the West region move in.

In terms of actual at large changes, it is likely that Oklahoma State, Memphis, and Buffalo would lose their predicted at large positions and would be replaced by California, Tennessee, and Colorado.