Thursday, November 9, 2023

REPORT 24: IN THE NCAA TOURNAMENT AT LARGE SELECTIONS, WHO BENEFITED FROM AND WHO GOT HURT BY THE NCAA RPI'S DEFECTS?

Now that we know the Women's Soccer Committee's at large selections, who benefited from and who got hurt by the current NCAA RPI's defects.  The following table is similar to the tables I provided in earlier posts, except that it compares the Committee's actual selections to what the likely selections would have been if the Committee had used the Balanced RPI.  As discussed in the preceding reports, the Balanced RPI does not have the current NCAA RPI's defects.

The following table shows who benefited and who got hurt.  I will explain below the table.  First is the Key for the table, then the table.


Candidates To Be Considered for At Large Positions

In the table, the first critical groups are the teams highlighted in green and red.  Historically, all the Committee's at large selections have come from teams ranked #57 or better.  The green highlighting is for eight teams that are in the Top 57 under the Balanced RPI but not under the current NCAA RPI.  Thus these are teams that are hurt by the current NCAA RPI's defects by, effectively, being excluded from the candidate group for at large selections.  The red highlighting is for eight teams that are not in the Top 57 candidate group under the Balanced RPI but are in the group under the current NCAA RPI.    Thus these are teams that benefit from the current NCAA RPI's defects by being included in the candidate group for at large selections.

There is a clear difference in the natures of the two groups.  The group that gets hurt by the current NCAA RPI is all Power 5 teams with one exception.  The group that correspondingly benefits is all non-Power 5 teams with one exception.  This is exactly as expected, since the current NCAA RPI discriminates against stronger conferences and in favor of weaker ones.

Regarding the two groups of teams, the three right-hand columns show important information.  Third from the right, the column shows the average current NCAA RPI rank of the team's opponents.  Second from the right, the column shows the average current NCAA RPI Strength of Schedule contribution rank of the team's opponents.  On the far right, the column shows the difference between these numbers.  Using Virginia as an example, the average current NCAA RPI rank of its opponents is 130.  The average current NCAA RPI strength of schedule contribution rank of its opponents, however, is only 175.  Thus according to the RPI itself, the formula's strength of schedule calculation understates Virginia's opponents' strength by 45 positions.  Contrast this to the red group's Lamar.  Lamar's current NCAA RPI opponents' average rank is 225, those same opponents' average rank as strength of schedule contributors is 199, so that according to the RPI itself, the formula overstates Lamar's opponents' strength by 26 positions.  If you look at the teams as red and green groups, it is clear:  The current NCAA RPI's strength of schedule problem is causing teams (red) that should not be in the at large candidate group to be in the group and preventing teams (green) that should be in the group from being there.

Selections for At Large Positions

The second critical groups are the teams highlighted C and D in the Category column.  The C teams are ones that did not get at large positions this year, but that likely would have gotten at large positions if the Committee had used the Balanced RPI: Virginia, Wake Forest, Northwestern, TCU, Washington, and UCF.  These are the teams that got hurt the most by the current NCAA RPI's defects.  Of these, TCU and UCF are in the current NCAA RPI's Top 57, but the other four are not.  The D teams are ones that did get at large positions, but that likely would not have if the Committee had used the Balanced RPI: Arizona State, Providence, Tennessee, Texas A&M, James Madison, and LSU.

For these second groups, you can see that this is not necessarily a matter of Power 5 versus non-Power 5 conferences.  Rather, it is a matter of the current NCAA RPI's defects having kept deserving teams from even getting realistic consideration for at large positions both by underrating them and by overrating other teams so that they occupy the limited candidate group positions.

Bottom Line

The bottom line this year is that:

Arizona State, Providence, Tennessee, Texas A&M, James Madison, and LSU benefitted from the current NCAA RPI's defects; and

Virginia, Wake Forest, Northwestern, TCU, Washington, and UCF got hurt by the defects.

Monday, November 6, 2023

REPORT 23: NCAA TOURNAMENT BRACKET PROJECTIONS

My system comes up with the following NCAA Tournament bracket projections, based on all of the season's results.  I will explain how the system works as I go along:

#1 Seeds


This table is for the Top 7 teams in the RPI rankings because historically all #1 seeds have come from the Top 7 in the rankings.  My system evaluates teams using 118 factors, each of which relates to the factors the NCAA requires the Committee to use in evaluating teams for at large selections (most of the 118 are combinations of two individual factors).  Most of the 118 factors have a "yes" value and a "no" value.  If a team's profile meets a yes value, it means teams that meet that value always have received a positive decision from the Committee, in this case a #1 seed.  If a team's profile meets a no value, it means teams that meet that value never have received a positive decision, thus in this case no #1 seed.  If a team meets both yes and no values, it means the team has a profile the Committee has not seen before.

As you can see in the table, Florida State and UCLA meet at least 1 yes value and 0 no values.  Thus the system identifies them as #1 seeds.  (The team ranked #1 by the RPI always has gotten a #1 seed.)  BYU has a profile the Committee has not seen before.

The table leaves BYU and the teams other than Florida State and UCLA to choose from for the remaining two #1 seeds.  Texas Tech and Penn State have too many no values.  This leaves BYU, Stanford, and Clemson as the candidates for the two remaining #1 slots.


Based on past history, after identifying clear #1 seeds, the factor that is most consistent with the Committee's picks for the remaining #1 seeds is their Head to Head v Top 60 Rank.  This is based on a scoring system I developed that measures results against Top 60 opponents -- without regard for the ranks of those opponents.  Using this as the tiebreaker, my system assigns the remaining #1 seeds to BYU and Stanford.

#2 Seeds


Using the same approach as for #1 seeds, the candidate group for #2 seeds is teams ranked #14 or better.  Here, Arkansas is a clear #2 seed.  After that, Penn State, North Carolina, Memphis, and Clemson all have profiles the Committee has not seen before.  In addition, Texas Tech and Georgetown are potential #2 seeds.


The tiebreaker factor for #2 seeds combines a team's RPI rank with its Top 50 Results rank, each weighted at 50%.  The Top 50 Results rank is based on a scoring system I developed, which is heavily weighted towards good results (wins or ties) against very highly ranked teams.  It essentially asks, at how high of a level have you shown you are able to compete.  It does not take losses into consideration.

As you can see, the tiebreaker assigns the remaining #2 seeds to Texas Tech, North Carolina, and Clemson.

#3 Seeds


The candidate group for #3 seeds is teams ranked #23 or better.  Brown is a clear #3 seed.  Penn State and Memphis are candidates with profiles the Committee has not seen before.  Georgetown, Notre Dame, Georgia, and Pittsburgh also are in the running.


The tiebreaker for #3 seeds is a combination of a team's RPI rating and its Top 60 Head to Head score rank.  The tiebreaker assigns the remaining #3 seeds to Penn State, Memphis, and Georgetown.

#4 Seeds


The candidate group for #4 seeds is teams ranked #26 or better.  Harvard and Georgia are clear #4 seeds.  Notre Dame, Pittsburgh, and Wisconsin also are in the running.


Here, the tiebreaker is a combination of a team's Top 50 Results rank and its conference's RPI.  The tiebreaker assigns the remaining #4 seeds to Wisconsin and Notre Dame.

#5 through #8 Seeds


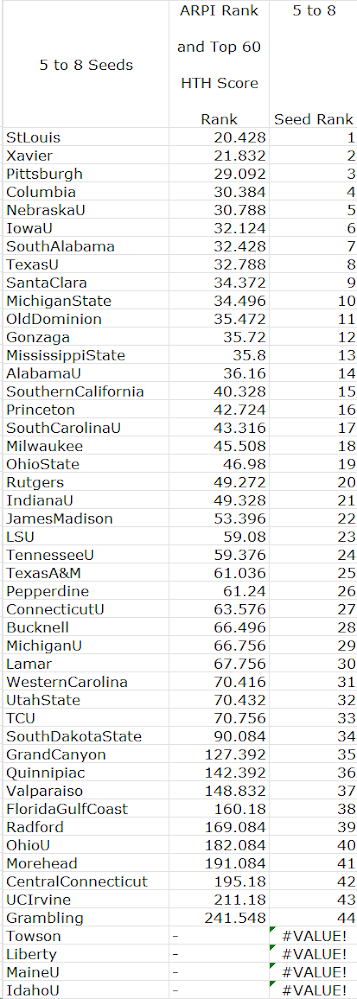
We did not have #5 through #8 seeds until last year.  Because of that, we do not have an historic Committee pattern for those seeds.  That being the case, I simply have used the combination of a team's RPI rank and its Top 50 Results rank as the basis for those seeds.  This yields St. Louis, Xavier, Pittsburgh, and Columbia as #5 seeds; Nebraska, Iowa, South Alabama, and Texas as #6 seeds; Santa Clara, Michigan State, Old Dominion, and Gonzaga as #7 seeds; and Mississippi State, Alabama, Southern California, and Princeton as #8 seeds.

At Large


The candidate group for at large positions is teams ranked #57 or better.  With the seeds and unseeded Automatic Qualifiers already set, there are 12 remaining at large positions.  The above table says that South Carolina, TCU, Ohio State, and Indiana are clear at large teams, which leaves 8 positions to fill.  Tennessee, Michigan, and LSU are possibilities with profiles the Committee has not seen before.  Rutgers, James Madison, Pepperdine, UCF, Arizona State, Connecticut, and Texas A&M also are possibilities.  


The at large tiebreaker is the combination of RPI rank and Top 60 Head to Head results rank.  This is a change from prior years when RPI rank and Top 50 Results score rank was the best predictor of at large selections.  Although I prefer the latter as a tiebreaker, the current statistical best predictor is the former, so that is what the above table shows.  Based on this, Rutgers, James Madison, LSU, Tennessee, Texas A&M, Pepperdine, Connecticut, and Arizona State are the system's last 8 at large selections.

Overall

Based on the above, the following table shows the system's seeds, the unseeded Automatic Qualifiers (5 in the NCAA Seed or Selection column), the unseeded at large selections (6 in the NCAA Seed or Selection column), and teams from the Top 57 at large candidate group not getting at large selections (7 in the NCAA Seed or Selection column).


Wednesday, November 1, 2023

REPORT 22: THE IVY LEAGUE AND THE RPI

 "There were teams and leagues that were able to trick the RPI, either intentionally or unintentionally."

Mark Few, Gonzaga men's basketball coach, in the Spokane Spokesman-Review, August 22, 2018

In 2018, the NCAA stopped using the RPI for men's basketball, replacing it with a different system.  This happened because Mark Few and other NCAA basketball coaches fought for the change.  Will DI women's soccer coaches follow their lead and fight for a change?  Of course, their situation is different as this is "just" women's soccer we are talking about, a change would be energy and time-consuming for NCAA staff, and they have many other jobs to do that they probably think are more important.  But one thing is certain:  There will not be change unless the coaches demand it.

This year, the RPI status of the Ivy League provides an excellent case in point for Mark Few's statement.  For games through October 29, the Ivies are the #2 ranked conference according to the RPI and that is almost sure to be where they end up.  According to my Balanced RPI, however, they are the #5 conference.  And, according to Massey, they are #7.  So, what gives?

Below are three tables, each with the same data but arranged differently.  The tables cover the Ivies' non-conference games.  In the tables, the blue highlights games the Ivy teams won.  The green highlights ties.  The peach highlights losses.

The first table is arranged by Ivy team, with the teams in their RPI rank order:


Using Brown as an example, the blue games are ones it won.  In the next-to-right-hand columns you can see Brown's rank as of October 29, which was #5.  In the right-hand column you can see the ranks of the opponents it beat.  As you can see, its best non-conference win was against the #152 ranked team.  The green games are ones it tied, both home games, against the teams ranked #13 and #62.  The peach game is a loss, an away game against the team ranked #35.

If you go through each team, you can make your own judgment whether its non-conference results seem consistent with its RPI rank.

The second table has the games arranged not by team but instead by wins, then ties, then losses, with each group's games in order of the opponent RPI ranks:


In looking at this table, bear in mind that the top four Ivy teams' ranks are #5 (Brown), #12 (Princeton), #16 (Harvard), and #24 (Columbia).

If you look at the wins rows at the top of the table, you will see that the Ivies have only one win against a team in the Top 30, a Princeton win at home against #14.  The Ivies' next best win is against #35 and they have a total of only 5 wins against teams in the Top 50.

If you look at the ties, the Ivies have only one tie against a team in the Top 30, a Brown tie at home against #13.  The Ivies' next best tie is against #34 and they have a total of only 3 ties against teams in the Top 50.  Brown has a tie at home against #62, Princeton has a tie away against #191, and Columbia has a tie away against #101.

If you look at the losses, Brown has an away loss to #35, Princeton has a home loss to #60, Harvard has away losses to #67 and #99, and Columbia has an away loss to #28.

In looking at the Ivies' poor ties and losses, it is important to remember that highly ranked teams do have occasional poor results.  The question here, however, is whether the totality of good results and poor results is consistent with having teams ranked #5, #12, #16, and #24.

The final table has the games arranged by opponents' geographic regions, then wins, losses, and ties within the regions, and then by opponent RPI ranks.


The first thing the table shows is that the Ivies played very few games outside their geographic region.  Thus their non-conference records mainly show where they fit within the North region.

The other thing the table shows may be revealing, although it is based on limited data.  The West is the strongest region based on average RPIs.  Against teams from the West, the Ivies' two wins are against teams ranked #186 and #230.  Harvard has an away tie against #39, Brown has a home tie against #62, and Columbia has an away tie against #101.  Columbia has an away loss to #28 and Harvard an away loss to #99.  These result suggest that there is something amiss in how the RPI ranks the Ivies in relation to teams from the West.

The above close looks at the Ivies' good and poor results strongly suggest that they are significantly overrated: Neither their good results nor their poor results support their ranks.  This raises the question of why this is happening.  The answer is in Mark Few's statement at the top of this report: Leagues are able to trick the RPI, whether intentionally or unintentionally.

In this case, every one of the Ivies had a good to excellent non-conference record, achieved mostly against opponents from the relatively weak North region.  They brought these records into conference play and because the RPI Strength of Schedule formula is based primarily on an opponent's winning record, each team bolstered every other team's RPI Strength of Schedule.  They were able to do this even though the opponents against whom they achieved their non-conference winning records by and large were unimpressive.  Simply put, the Ivies have tricked the RPI, whether intentionally or unintentionally.

Will the DI women's soccer coaches continue to put up with this situation?  Time will tell.