Tuesday, September 26, 2023

REPORT 13: UPDATE INCORPORATING RESULTS THROUGH SUNDAY, SEPTEMBER 24

This is my sixth weekly report for the 2023 season.  From here on out, the weekly reports will follow this format.

Starting this week I am adding teams’ current RPI ratings, including showing teams in the current history-based candidate groups for NCAA Tournament #1 through #4 seeds and at large selections.  In addition, I will continue to show, using the actual results of games played to date and simulated results for games not yet played (including simulated conference tournaments):

1.  Teams’ simulated end-of-season ranks using the current NCAA RPI and my Balanced RPI;

2.  Based on the current NCAA RPI, teams in candidate pools (expanded) for NCAA Tournament #1, 2, 3, and 4 seeds and for at large selections and where they fit within the pools; and

3.  Likely differences in at large selections for the NCAA Tournament if the Women’s Soccer Committee were to use the Balanced RPI rather than the current NCAA RPI.

The background for the information is in 2023 Reports 1 through 4.

Summarizing the likely differences in at large selections for the NCAA Tournament in changing from the current NCAA RPI to the Balanced RPI, derived from the last table below:

At Large Candidate Teams:  Ten teams that are not at large candidates under the current NCAA RPI are candidates under the Balanced RPI.  Of these, 6 are from the Middle, 2 from the South, 1 from the West, and 1 from the North regions.  All 10 are from Power 5 conferences.

No Longer Candidate Teams:  Ten teams that are at large candidates (or Automatic Qualifiers) under the current NCAA RPI are not candidates under the Balanced RPI.  Of these, 5 are from the South, 3 from the North, 1 from the Middle, and 1 from the West regions.  One is from a Power 5 conference and 9 are not.  Of these, all but 1 either are Automatic Qualifiers or likely would not get at large selections under the current NCAA RPI.  One likely would have gotten an at large selection under the current NCAA RPI.

Selected Teams: Five teams that either definitely or likely are not at large selections under the current NCAA RPI likely are at large selections under the Balanced RPI.  Of these, 2 are from the West, 1 from the Middle, 1 from the North, and 1 from the South regions.  All 5 are from Power 5 conferences.

No Longer Selected Teams: Five teams that likely are at large selections under the current NCAA RPI likely are not at large selections under the Balanced RPI.  Of these, 3 are from the South, 1 from the Middle, and 1 from the North regions.  1 is from a Power 5 conference and 4 are not.

The basic change pattern is that teams dropped from the at large candidate pool mostly either are Automatic Qualifiers or likely are not at large selections under the current RPI, so they are not hurt by a change to the Balanced RPI.  But of the teams added to the candidate pool under the Balanced RPI, some likely are at large selections, displacing teams that are at large selections under the current NCAA RPI.  Thus the effect of the defects in the current NCAA RPI is to prevent teams that deserve at large selections from even being considered by the Committee, with the result that less deserving teams are getting at large selections.

Current RPI Rankings

The first table below shows teams’ current RPI ranks, their strength of schedule contributor ranks, their opponents’ average RPI ranks, and their opponents’ average strength of schedule contributor ranks.  These will help you see the differences between team RPI ranks and strength of schedule contributor ranks -- in an ideal rating system, those ranks should be the same.  In addition, the table shows the same rank items for my Balanced RPI.  And, on the left, the table shows teams that are potential #1 through #4 seeds and at large selections, at this stage of the season, based on Committee decisions since 2007.  The poorest ranked team in any candidate group is the poorest ranked team as of the current week that the Committee gave a positive decision to in its end of season decision process.

The second table shows average ranks for conferences, again allowing comparisons of average RPI ranks and average strength of schedule contributor ranks.  The third table is similar, but is for geographic regions.

NOTE: The NCAA published RPI ranks and ratings for games through September 24 include one item of erroneous data.  They include a September 3 erroneous result of the game between Jacksonville and Presbyterian as a 4-2 win by Jacksonville rather than the actual result of a 2-2 tie.  Thus the currently published NCAA ratings and ranks are slightly different than mine.  The schools are working on correcting the error, so hopefully the NCAA will have the correct data by its next publication date.


Simulated End-of-Season Ranks

(ARPI 2015 BPs is the current NCAA RPI; URPI 50 50 SoS Iteration 15 is the Balanced RPI)


Simulated NCAA Tournament Seed and At Large Selection Candidate Pools (based on current NCAA RPI)

At Large (showing Top 80 teams)


#1 Seeds (showing Top 11 teams):


#2 Seeds (showing top 20 teams)


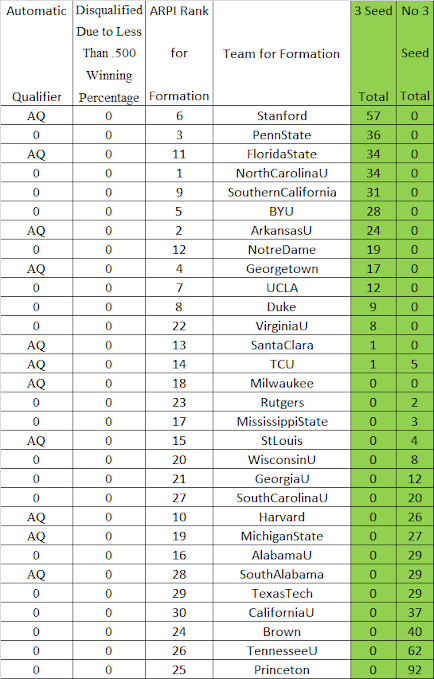
#3 Seeds (showing Top 30 teams)


#4 Seeds (showing Top 40 teams)


Simulated NCAA Tournament At Large Selections Using Current NCAA RPI As Compared To Balanced RPI


Wednesday, September 20, 2023

REPORT 12: ACTUAL RPI RATINGS FOR GAMES THROUGH SUNDAY, SEPTEMBER 17

Here are team actual RPI ratings and ranks and related information based on games played through Sunday, September 17.  If you compare these to the published NCAA ratings and ranks, you will see some relatively small differences.  These are because the NCAA RPI data system had two erroneous game results at the time it did its calculations:

It had UN Omaha beating Utah Tech, but the game actually was a tie.  I suspect this already has been corrected within the NCAA system.

It had Jacksonville beating Presbyterian, but the game actually was a tie.  It appears to me that the game score got mis-entered into the NCAA system.

 I will check next week to see if these errors have been corrected.

In the table, you will need to use the scroll bar at the bottom to see all of the data for each team.

Of particular interest, note the differences between (1) team NCAA RPI ranks and their ranks as NCAA RPI Strength of Schedule contributors to their opponents and (2) the average NCAA RPI ranks of team opponents as compared to the average NCAA RPI Strength of Schedule contributor ranks of those opponents.


Tuesday, September 19, 2023

REPORT 11: UPDATE INCORPORATING RESULTS THROUGH SEPTEMBER 17

This is my fifth weekly report for the 2023 season.  Each week I show, using the actual results of games played to date and simulated results for games not yet played (including simulated conference tournaments):

1.  Teams’ simulated end-of-season ranks using the current NCAA RPI and my Balanced RPI;

2.  Based on the current NCAA RPI, teams in candidate pools (expanded) for NCAA Tournament #1, 2, 3, and 4 seeds and for at large selections and where they fit within the pools; and

3.  Likely differences in at large selections for the NCAA Tournament if the Women’s Soccer Committee were to use the Balanced RPI rather than the current NCAA RPI.

The background for the information is in 2023 Reports 1 through 4.

Summarizing the likely differences in at large selections for the NCAA Tournament in changing from the current NCAA RPI to the Balanced RPI, derived from the last table below:

At Large Candidate Teams:  7 teams that are not at large candidates under the current NCAA RPI are candidates under the Balanced RPI.  Of these, 3 are from the West, 2 from the Middle, 1 from the South, and 1 from the North regions.  6 are from Power 5 conferences and 1 is not.

No Longer Candidate Teams:  7 teams that are at large candidates (or Automatic Qualifiers) under the current NCAA RPI are not candidates under the Balanced RPI.  Of these, 3 are from the Middle, 2 from the North, 1 from the South, and 1 from the West regions.  All 7 are not from Power 5 conferences.  Of these, all either are Automatic Qualifiers or likely would not get at large selections under the current NCAA RPI.

Selected Teams: 4 teams that either definitely or likely are not at large selections under the current NCAA RPI likely are at large selections under the Balanced RPI.  Of these, 2 are from the West and 2 from the Middle regions.  3 are from Power 5 conferences and 1 is not.

No Longer Selected Teams: 4 teams that likely are at large selections under the current NCAA RPI likely are not at large selections under the Balanced RPI.  Of these, 2 are from the South, 1 from the Middle, and 1 from the North regions.  1 is from a Power 5 conference and 3 are not.

The basic change pattern is that teams dropped from the at large candidate pool either are Automatic Qualifiers or likely are not at large selections under the current RPI, so they are not hurt by a change to the Balanced RPI.  But of the teams added to the candidate pool under the Balanced RPI, some likely are at large selections, displacing teams that are at large selections under the current NCAA RPI.  Thus the effect of the defects in the current NCAA RPI is to prevent teams that deserve at large selections from even being considered by the Committee, with the result that less deserving teams are getting at large selections.

Simulated End-of-Season Ranks

(ARPI 2015 BPs is the current NCAA RPI; URPI 50 50 SoS Iteration 15 is the Balanced RPI)


NCAA Tournament Seed and At Large Selection Candidate Pools (based on current NCAA RPI)

At Large (showing Top 80 teams)


#1 Seeds (showing Top 12 teams):


#2 Seeds (showing top 20 teams)


#3 Seeds (showing Top 30 teams)


#4 Seeds (showing Top 40 teams)


NCAA Tournament At Large Selections Using Current NCAA RPI As Compared To Balanced RPI


Monday, September 11, 2023

REPORT 10: UPDATE INCORPORATING RESULTS THROUGH SEPTEMBER 10

 This is my fourth weekly report for the 2023 season.  Each week I show:

1.  Teams’ simulated ranks using the current NCAA RPI and my Balanced RPI;

2.  Based on the current NCAA RPI, teams in candidate pools (expanded) for NCAA Tournament #1, 2, 3, and 4 seeds and for at large selections and where they appear to fit within the pools; and

3.  Likely differences in at large selections for the NCAA Tournament if the Women’s Soccer Committee were to use the Balanced RPI rather than the current NCAA RPI.

The background for the information is in 2023 Reports 1 through 4.

Each week, I replace my simulated results for the previous week with actual results.  So this week’s information is based on actual results of games played through Sunday, September 10, and simulated results of games not yet played.

Summarizing the likely differences in at large selections for the NCAA Tournament in changing from the current NCAA RPI to the Balanced RPI, derived from the last table below:

At Large Candidate Teams:  9 teams that are not at large candidates under the current NCAA RPI are candidates under the Balanced RPI.  Of these, 4 are from the West, 2 from the South, 2 from the Middle, and 1 from the North regions.  8 are from Power 5 conferences and 1 is not from a Power 5 conference.

No Longer Candidate Teams:  9 teams that are at large candidates (if not Automatic Qualifiers) under the current NCAA RPI are not candidates under the Balanced RPI.  Of these, 4 are from the North, 2 are from the South, and 3 are from the Middle regions.  All 9 are from non-Power 5 conferences.  Of these, all either are Automatic Qualifiers or likely would not get at large selections under the current NCAA RPI.

Selected Teams: 6 teams that likely are not at large selections under the current NCAA RPI likely are at large selections under the Balanced RPI.  Of these, 3 are from the West, 2 from the Middle, and 1 from the South regions.  5 are from Power 5 conferences and 1 is not.

No Longer Selected Teams: 6 teams that likely are at large selections under the current NCAA RPI likely are not at large selections under the Balanced RPI.  Of these, 2 are from the North and 4 from the South.  1 is from a Power 5 conference and 5 are not. 

The basic change pattern is that teams dropped from the at large candidate pool either are Automatic Qualifiers or likely are not at large selections under the current RPI, so they are not hurt by a change to the Balanced RPI.  But of the teams added to the candidate pool under the Balanced RPI, some likely are at large selections, displacing teams that are at large selections under the current NCAA RPI.  Thus the effect of the defects in the current NCAA RPI is to prevent teams that deserve at large selections from even being considered by the Committee, with the result that less deserving teams are getting at large selections.

I have added two additional columns to the last table below, on the right.  These show teams’ opponents’ average current NCAA RPI ranks and then the opponents’ average current NCAA RPI Strength of Schedule Contribution ranks.  If you look at these columns for the teams that are in the at large candidate pool under the Balanced RPI but not under the current NCAA RPI, you will see that for all but one of these teams the current NCAA RPI underrates their Strengths of Schedule, with 1 rated about right.  On the other hand, for the teams that drop out of the candidate pool under the Balanced RPI, the current NCAA RPI underrates only 2 of their Strengths of Schedule and either rates the others’ strengths of schedule about right or overrates their Strengths of Schedule.  It is the defective Strength of Schedule ratings that cause the wrong teams to be in the Top 57 at large candidates group.

Simulated Ranks

(ARPI 2015 BPs is the current NCAA RPI; URPI 50 50 SoS Iteration 15 is the Balanced RPI)


NCAA Tournament Seed and At Large Selection Candidate Pools (based on current NCAA RPI)

At Large (showing Top 80 teams)


#1 Seeds (showing Top 10 teams):  Note:  At this point, the pickings for a #1 seed are looking pretty slim.


#2 Seeds (showing top 20 teams)


#3 Seeds (showing Top 30 teams)


#4 Seeds (showing Top 40 teams)


NCAA Tournament At Large Selections Using Current NCAA RPI As Compared To Balanced RPI


2023 REPORT 9: AN ILLUSTRATION SHOWING WHY THE CURRENT NCAA RPI IS DEFECTIVE AND THE EFFECT OF THE DEFECT PART 2

In the previous post, I used Quinnipiac and Nebraska during the 2022 season to illustrate why the current NCAA RPI is defective and the potential effects of the defect on NCAA Tournament at large selections.  As shown in that post, the defect is in how the current NCAA RPI formula computes Strength of Schedule.  That SoS computation results in teams’ RPI ranks and their ranks as Strength of Schedule contributors often being quite different, when logically they should be the same.  This is a defect that the Balanced RPI corrects.

Again using the 2022 season, when I apply the Balanced RPI rather than the current NCAA RPI to the season’s results, there are eight teams that become candidates for at large selection (Top 57 in the rankings) that were not under the current NCAA RPI.  The following table shows those eight teams.  Also, for each of them, the table shows (1) using the current NCAA RPI, the average rank of its opponents and the average Strength of Schedule contributor rank of its opponents and (2) using the Balanced RPI, the opponents’ average rank and average Strength of Schedule contributor rank.  [In the table, ARPI 2015 BPs is the current NCAA RPI and URPI 50 50 Sos Iteration 15 is the Balanced RPI.]


As you can see, in every case the current RPI formula significantly underrates Strength of Schedule as compared to the opponents’ RPI ranks.  5 of these teams are from the West, 1 from the Middle, and 2 from the South regions.  6 are from Power 5 conferences and 2 from a strong non-Power 5 conference, in other words all are from strong conferences.

Matching these eight teams are eight other teams that are in the candidate pool under the current NCAA RPI but not under the Balanced RPI.


Of these, 3 are from the South, 2 from the Middle, 2 from the North, and 1 from the West regions.  2 are from Power 5 conferences and 6 are from non-Power 5 conferences, in otherwords they are predominantly from non-Power 5 conferences.  As the table shows, the current NCAA RPI underrates the 2 Power 5 conference teams’ Strengths of Schedule as compared to their current NCAA RPI ranks, overrates 2 non-Power 5 teams’ Strengths of Schedule as compared to their current NCAA RPI ranks, and gets 4 non-Power 5 teams’ Strengths of Schedule about right as compared to their current NCAA RPI ranks.

In considering the differences between the current NCAA RPI ranks and the Balanced RPI ranks in these tables, it is important to remember that the same Strength of Schedule measurement problem you are seeing for the above teams also affects all other teams.  The Balanced RPI ranks are based on correcting the strength of schedule problem for all teams.  The differences you see between the Balanced RPI ranks and the current NCAA RPI ranks are the result of all of those corrections.


Tuesday, September 5, 2023

2023 REPORT 8: AN ILLUSTRATION SHOWING WHY THE CURRENT NCAA RPI IS DEFECTIVE AND THE EFFECT OF THE DEFECT

"[T]he basic premise of the [RPI] formula remains true for any sport -- rankings are based on whom a team plays and whom it beats.  ... [A]lmost any discussion by schools, media or fans about why a team was or was not selected [as an at large participant in the NCAA Tournament] usually involve that team’s record or its strength of schedule."  (Emphasis added.)  From Frequently Asked Questions About the Women’s Soccer Rating Percentage Index, by Jim Wright (NCAA Director of Statistics at the time of the statement, who helped create the original RPI and worked for the NCAA Statistics Service for 30 years) and Rick Campbell (NCAA Assistant Director of Statistics at the time of the statement, who was on the NCAA statistics staff for 18 years and managed the women’s soccer RPI for six years) 

Consistent with the above statement, the current NCAA RPI measures two things:  a team’s Winning Percentage (its record) and its Strength of Schedule (who its opponents are).  It then combines the two with each having a 50% weight.

The way in which the NCAA measures the team’s Winning Percentage is straight forward:

(Wins + 0.5 x Ties)/(Wins + Ties + Losses)

The way in which it measures strength of schedule is less straight forward:

2 x Average of Opponents’ Winning Percentages + 1 x Average of Opponents’ Opponents’ Winning Percentages

Under this formula, the Opponents’ Winning Percentages element comprises roughly 80% of the effective weight of Strength of Schedule and the Opponents’ Opponents’ Winning Percentages element comprises roughly 20%.  For an explanation of why the 80-20 ratio, see RPI: Formula at the RPI for Division I Women’s Soccer website.

With Strength of Schedule comprising 50% of the effective weight of the overall RPI, the current NCAA RPI rating consists of 50% Winning Percentage, 40% Opponents’ Winning Percentages, and 10% Opponents’ Opponents’ Winning Percentages.  Teams are ranked accordingly.  On the other hand how a team is rated as a contributor to other teams’ Strengths of Schedule consists of 80% Winning Percentage and 20% Opponents’ Winning Percentages.  Teams are ranked as Strength of Schedule contributors accordingly.

In other words, a team has two different rankings:  (1) Its RPI rank and (2) its rank as a Strength of Schedule contributor.  These two ranks, since they are determined by quite different formulas, can be very different.  This is an RPI defect that has significant effects.  (NOTE: The NCAA does not publish teams’ ranks as Strength of Schedule contributors, so far as I know.)

To illustrate the effects of how the NCAA RPI calculates Strength of Schedule, I will use a real life case from the 2022 season involving Quinnipiac and Nebraska and the NCAA Tournament at large selections.

As a starting point, since 2007, the poorest ranked team to get an at large selection is #57.  Thus effectively, the candidate pool for at large selections is teams ranked #57 or better.  With that as context, here is a table for Quinnipiac and Nebraska:


In the table, ARPI 2015 BPs is the current NCAA RPI.  As you can see from the first highlighted column, Quinnipiac ended the season ranked #43 and Nebraska #58.  Thus Quinnipiac, by being rated in the Top 57, effectively pushed Nebraska just outside the candidate pool for at large selections.

The second highlighted column shows the average current NCAA RPI ranks of the teams’ opponents: 84 for Nebraska and 207 for Quinnipiac.  The third highlighted column shows the ranks under the current NCAA RPI of the teams’ opponents as Strength of Schedule contributors: 117 for Nebraska and 196 for Quinnipiac.  As I stated above, current NCAA RPI ranks can be very different than ranks as Strength of Schedule contributors and that is the case here.  For Nebraska, the RPI formula underranks its opponents’ strength by 33 positions on average.  For Quinnipiac, it overranks its opponents’ strength by 11 positions.

Here are the teams’ schedules, with the opponents’ current NCAA RPI ranks and their current NCAA RPI formula Strength of Schedule contributor ranks, to show this in more detail:

Nebraska


Quinnipiac


The NCAA requires the Women’s Soccer Committee to use the current NCAA RPI ranks in its at large selection process, thus inherently taking the position that those rankings are correct as compared to teams’ ranks as Strength of Schedule contributors.  This being the case, a necessary implication is that the RPI formula significantly underrates the strength of Nebraska’s opponents within its calculations and overrates the strength of Quinnipiac’s opponents.  In other words, the formula is biased against Nebraska and in favor of Quinnipiac.

Where would the two teams be in the rankings without those biases?  This is the question the Balanced RPI answers.  (The design of the Balanced RPI gets teams’ RPI ranks and their ranks as Strength of Schedule contributors so they match.)  You can find a full explanation of the Balanced RPI at the RPI: Modified RPI? page of the RPI for Division I Women’s Soccer website.

The following table matches the first table in this article, but using the Balanced RPI:


In the table, the URPI 50 50 SoS Iteration 15 is the Balanced RPI.  As you can see, when the differences between teams’ RPI ranks and their ranks as Strength of Schedule contributors are eliminated, we end up with very different rankings from the current NCAA RPI.  Now, Nebraska is #46 and a candidate for at large selection and Quinnipiac is #82 and not a candidate.

In fact, this does not matter for Quinnipiac, as it is an Automatic Qualifier.  But it does matter for Nebraska.  (It is important to note that the process of equalizing RPI rank and Strength of Schedule contributor ranks has moved a lot of other teams around too, some moving up in the rankings and some moving down.  When all the movement is over, this is where Nebraska and Quinnipiac end up.)

How much does it matter for Nebraska?  I have developed a scoring system for good results (wins or ties) against Top 50 opponents.  When I combine team ranks under that scoring system with their RPI ranks, each weighted at 50%, and then rank teams based on those combined factors, those rankings match the NCAA Tournament at large selections since 2007 for an average of all but 2 selections per year.  In other words, those rankings are a very good indicator of the Committee’s likely at large selections.  In the case of Nebraska and using the Balanced RPI, those rankings indicate it likely would have been an at large selection.

The bottom line is that because of the defects in the current NCAA RPI, teams like Quinnipiac that should be outside the Top 57 at large candidate pool are in the pool and teams like Nebraska that should be in the pool are outside it.  And, some of the teams that should be in the pool, such as Nebraska, likely would get at large positions.

Finally, as shown on the RPI: Modified RPI? linked page, in most cases the teams that should be outside the candidate pool but are in it due to the defects of the current NCAA RPI are from weaker conferences and/or regions and teams that should be inside the pool but are outside it under the current NCAA RPI are from stronger conferences and/or regions.  Thus Quinnipiac and Nebraska provide an excellent illustration of the current NCAA RPI’s defect and of the effects of the defect.

2023 REPORT 7: UPDATE INCORPORATING RESULTS THROUGH SEPTEMBER 4

 This is my third weekly report for the 2023 season.  Each week I show:

1.  Teams’ simulated ranks using the current NCAA RPI and my Balanced RPI;

2.  Based on the current NCAA RPI, teams in candidate pools (expanded) for NCAA Tournament #1, 2, 3, and 4 seeds and for at large selections and where they appear to fit within the pools; and

3.  Likely differences in at large selections for the NCAA Tournament if the Women’s Soccer Committee were to use the Balanced RPI rather than the current NCAA RPI.

The background for the information is in 2023 Reports 1 through 4.

Each week, I replace my simulated results for the previous week with actual results.  So this week’s information is based on actual results of games played through Monday, September 4 (Labor Day), and simulated results of games not yet played.

Summarizing the likely differences in at large selections for the NCAA Tournament in changing from the current NCAA RPI to the Balanced RPI, derived from the last table below:

At Large Candidate Teams:  11 teams that are not at large candidates under the current NCAA RPI are candidates under the Balanced RPI.  Of these, 4 are from the West, 3 from the South, and 4 from the Middle regions.  9 are from Power 5 conferences and 2 are from other conferences.

No Longer Candidate Teams:  11 teams that are at large candidates (if not Automatic Qualifiers) under the current NCAA RPI are not candidates under the Balanced RPI.  Of these, 6 are from the North, 2 are from the South, and 3 are from the Middle regions.  All 11 are from non-Power 5 conferences.  Of these, all either are Automatic Qualifiers or likely would not get at large selections under the current NCAA RPI.

Selected Teams: 5 teams that likely are not at large selections under the current NCAA RPI likely are at large selections under the Balanced RPI.  Of these, 3 are from the West, 1 from the Middle, and 1 from the South regions.  All 5 are from Power 5 conferences.

No Longer Selected Teams: 5 teams that likely are at large selections under the current NCAA RPI likely are not at large selections under the Balanced RPI.  Of these, 3 are from the North and 2 from the South.  All 5 are from mid-majors.  Of the 3 North teams likely losing at large selections, 2 fall outside the Balanced RPI candidate pool and 1 stays in the candidate pool but is replaced by a better candidate.  Of the 2 South teams likely losing at large selections, both stay in the candidate pool but are replaced by better candidates.

The basic change pattern is that teams dropped from the at large candidate pool either are Automatic Qualifiers or likely are not at large selections under the current RPI, so they are not hurt by a change to the Balanced RPI.  But of the teams added to the candidate pool under the Balanced RPI, some likely are at large selections, displacing teams that are at large selections under the current NCAA RPI.  Thus the effect of the defects in the current NCAA RPI is to prevent teams that deserve at large selections from even being considered by the Committee, with the result that less deserving teams are getting at large selections. 

Simulated Ranks

(ARPI 2015 BPs is the current NCAA RPI; URPI 50 50 SoS Iteration 15 is the Balanced RPI)

NCAA Tournament Seed and At Large Selection Candidate Pools (based on current NCAA RPI)

At Large (showing Top 80 teams)

#1 Seeds (showing Top 10 teams)


#2 Seeds (showing top 20 teams)


#3 Seeds (showing Top 30 teams)


#4 Seeds (showing Top 40 teams)


NCAA Tournament At Large Selections Using Current NCAA RPI As Compared To Balanced RPI