Friday, December 15, 2023

REPORT 26: FACTORS THAT MATCH BEST WITH THE WOMEN'S SOCCER COMMITTEE'S NCAA TOURNAMENT SEEDS AND AT LARGE SELECTIONS

The NCAA requires the Women's Soccer Committee to consider a number of criteria in making its NCAA Tournament at large selections.  The Committee also can use those criteria in seeding the bracket, but is not required to use them.  Based on the criteria, I created a list of 118 factors, some of which are the individual NCAA criteria and others of which combine those criteria in pairs with each criterion in the pair weighted at 50%.

At the end of each season, I look back over all the seasons since 2007, to see which factor, by itself, best matches the Committee decisions on seeds and at large selections from 2007 to the present.  This can be an aid for understanding how the "Committee mind" works.  It also can help teams understand what they need to schedule for and accomplish over the course of the season in order to get a seed or at large selection.

Here are the results of my look back for the years 2007 through 2023.

#1 Seeds

Each of four factors matched the Committee #1 seeds 84.4% of the time, equating to correctly matching 3.375 #1 seeds per year on average:

RPI Rating + Non-Conference RPI (NCRPI) Rank paired factor

RPI Rating + Conference Rank paired factor

RPI Rating + Top 60 Head to Head Results Score paired factor (based on head to head win-loss-tie results in games between Top 60 teams)

RPI Rating + Top 60 Head to Head Results Rank paired factor

#2 Seeds

Each of five factors matched the Committee #2 seeds 78.1% of the time, equating to correctly matching 3.125 #2 seeds per year on average (from teams remaining after the #1 seeds):

RPI Rating

RPI Rank

RPI Rating + RPI Rank paired factor

RPI Rating + Top 60 Common Opponents Results Score paired factor (based on comparing results of Top 60 teams against common opponents)

RPI Rating + Top 60 Common Opponents Results Rank paired factor

#3 Seeds

One factor matched the Committee #3 seeds 59.4% of the time, equating to correctly matching 2.375 #3 seeds per year on average (from teams remaining after the #1 and #2 seeds):

RPI Rank and Top 50 Results Rank paired factor (The Top 50 Results Score is based on good results -- wins or ties -- against Top 50 opponents and is highly skewed towards good results against very highly ranked opponents.)

#4 Seeds

One factor matched the Committee #4 seeds 56.3% of the time, equating to correctly matching 2.25 #4 seeds per year on average (from teams remaining after the #1, #2, and #3 seeds):

RPI Rank + Top 50 Results Rank paired factor

Top 16 Seeds Without Regard for Seed Position

Two factors matched the Committee's Top 16 seeds 87.5% of the time, equating to correctly matching 14 seeds per year on average:

RPI Rating + Top 60 Common Opponents Results Score paired factor

RPI Rank + Top 60 Common Opponent Results Rank paired factor

At Large Selections (from unseeded teams)

One factor matched the Committee at large selections 91.1% of the time, equating to correctly matching all but 2.06 at large selections per year on average (from teams remaining after the seeding of teams): 

RPI Rank + Conference Rank paired factor 

This was closely followed by another factor with a 90.8% match rate, equating to correctly matching all but 2.125 at large selections per year on average.  I mention this second factor because it is more useful for team scheduling purposes:

RPI Rank + Top 50 Results Rank paired factor

Thursday, December 14, 2023

REPORT 25: WOMEN'S SOCCER COMMITTEE INTERESTING DECISIONS ON NCAA TOURNAMENT SEEDS AND AT LARGE SELECTIONS

[NOTE: This report is based on the NCAA Tournament seed and at large selection process as currently mandated by the NCAA.  Under the current process, the Women's Soccer Committee can use only two rating systems when making at large selections:  the NCAA RPI and the KP Index (KPI).  It cannot consider any other rating or ranking system.  Further, as between the RPI and the KPI, the RPI must be the primary system the Committee uses.  It can use the KPI only if use of the RPI and other primary criteria does not result in a decision.  This report will mention two other rating systems, the Balanced RPI and the Massey ratings.  These mentions only are for informational purposes.  If the Committee were to use either one of those systems as a primary rating system, the pool of teams it would be considering for at large positions would be significantly different and it is highly likely this would result in teams not considered by the Committee receiving at large positions, with other teams being dropped from at large slots.  It also might affect seeding.]

Over the years, the Women's Soccer Committee has been relatively consistent in the patterns it follows when making NCAA Tournament seed and at large selection decisions.  This report discusses Committee decisions this year that did not exactly match the historic patterns.

South Alabama Not Getting an At Large Position

The only major change I see from historic decision patterns is the Committee not giving an at large position to RPI #27 South Alabama.

Since 2007, teams with RPI ranks of #30 or better always have gotten at large positions.  Moving the bar by three positions is a big change.

#55 Colorado got an at large position.  Thus the Committee concluded that in this area of the rankings, the RPI this year was off by 29 positions.  Further, in the past a team ranked as poorly as #57 has gotten an at large position, suggesting the RPI can be off by as many as 31 positions.

I use 118 metrics to evaluate teams, all based on the factors the NCAA requires the Committee to use in making at large selections.  Each metric has two standards.  One says "yes," if a team met the standard in the past, it always got an at large position.  The other says "no," if a team met that standard in the past, it never got an at large selection.  South Alabama met 11 "yes" standards and no "no" standards, thus looking like a sure thing for an at large position.  Ten of the "yes" standards, however, included use of South Alabama's RPI rating or its RPI rank.  Only one did not: South Alabama's rank in terms of Head to Head Results Against Top 60 Opponents paired with its rank in terms of Poor Results, each weighted at 50%.

In not giving South Alabama an at large position, the Committee effectively said it did not believe South Alabama's RPI rating and rank.

Note: The RPI ranked South Alabama #27.  The KPI ranked it #30.  Given this small difference, it seems unlikely the KPI played a significant part in the Committee not giving South Alabama an at large position.  The Balanced RPI ranked it #51, Massey ranked it #70.5, which support the Committee decision.

TCU Not Getting an At Large Position

TCU met three "yes" standards for an at large position and no "no" standards.  The "yes" standards all related to TCU's good results against Top 50 opponents.

The Committee deviated from the "yes" standards by not giving TCU an at large position.  The deviations were not large, however, rather moderate to small, so I do not consider this a major change from the Committee's historic patterns.

When I compare TCU's and South Alabama's opponents' ranks and their results against Top 50 opponents, I easily can imagine the Committee thinking that they could not possibly deny TCU an at large position yet give one to South Alabama.  This may have contributed to South Alabama not getting an at large position.

Note:  The RPI ranked TCU #54, the KPI #50.  The KPI thus was not a basis for the Committee decision.  The Balanced RPI ranked TCU #37, Massey #28, which suggest the Committee may have under rated it.

Providence Getting an At Large Position

Providence met no "yes" standards for an at large position and 1 "no" standard.  The Committee deviation from the "no" standard was minimal.

Note: The RPI ranked Providence #42, the KPI #39.  The KPI thus may have been a contributing factor for the Committee's decision.  The Balanced RPI ranked Providence #50, Massey #73.5, which suggest the Committee may have over rated it.

Colorado Getting an At Large Position

Colorado met no "yes" standards for an at large position and 1 "no" standard.  The Committee deviation from the "no" standard was moderate.

Note: The RPI ranked Colorado #55, the KPI #40.  The KPI thus may have been a contributing factor for the Committee's decision.  The Balanced RPI ranked Colorado #24, Massey #25, which support the Committee decision.

Tennessee Getting an At Large Position

Tennessee met 10 "yes" standards for an at large position and 2 "no" standards.  (When at team meets 1 or more "yes" standards and one or more "no" standards, it means the team has a profile the Committee has not seen in the past.)  The Committee deviations from the "no" standards were moderate to small.

Note:  The RPI ranked Tennessee #32, the KPI #33.  The KPI thus may have been a contributing factor for the Committee's decision.  The Balanced RPI ranked Tennessee #42, Massey #40, which suggest the Committee may have over rated it.

LSU Getting an At Large Position

LSU met 2 "yes" standards for an at large position and 4 "no" standards.  The Committee deviations from the "no" standards were moderate to small.

Note:  The RPI ranked LSU #52, the KPI #45.  The KPI thus may have been a contributing factor for the Committee's decision.  The Balanced RPI ranked LSU #59, Massey #55, which suggest the Committee may have over rated it.

At Large Summary

South Alabama, with its #27 RPI rank, not getting an at large position was a major change from the Committee's historic pattern.  The other Committee decisions represent moderate changes from the Committee's historic patterns, but are not unusual in relation to changes I have seen in prior years.

Clemson Getting a #1 Seed

Clemson met no "yes" standards for a #1 seed and 15 "no" standards.  The "no" standards all related to its RPI rating or rank and/or its rating or rank in terms of its Head to Head Results Against Top 60 Opponents.  The Head to Head Results factor evaluates its record in terms of wins, ties, and losses against other Top 60 opponents, without regard for where those opponents stand in the Top 60 rankings.  Clemson's deviations from the standards ranged from big to small.

Starting in 2022, the NCAA eliminated overtimes in regular season games.  As a result, the number of overtime games has doubled.  The increased number of overtime games tends to pull teams' RPI ratings towards 0.500, which has a negative effect on the RPI ratings of strong teams.  It also tends to reduce the calculated value of Head to Head Results Against Top 60 Opponents.  An expected effect of this is that fewer teams will meet the historic seed and at large selection standards for these factors.  If so, then as the Committee makes decisions over the next few years, I will need to recalibrate -- relax -- the standards to accommodate those decisions.

When I initially looked this year at how most of the teams at the top of the rankings did in relation to the historic standards, I thought that the top group seemed weaker than has been the case historically.  On further consideration it also is possible that they may appear weaker because of the effect of the increased number of ties and there not yet having been enough years under the no overtime rule to allow a full recalibration of the historic standards.  If this is the case, then Clemson's apparently poor profile for a #1 seed may be partly a reflection of the effect of the no overtime rule, illustrating how the historic standards will have to change to accommodate the new rule.  It also may be partly a reflection of weaker than usual candidates for a #1 seed.

Note:  The RPI ranked Clemson #5, the KPI #9.  The KPI thus did not support the Committee decision.  The Balanced RPI ranked Clemson #6, Massey #4.

BYU Getting a #1 Seed

BYU met 2 "yes" standards for a #1 seed and 14 "no" standards, which means it had a profile the Committee has not seen in the past.  The "no" standards mostly related to the Big Twelve's average RPI rating and/or rank.  Two of the "no" standards related to BYU's Head to Head Results Against Top 60 Opponents (see Clemson).  This year, the Big Twelve was the #7 rated conference, and BYU was second in the regular season standings to Texas Tech and runner up in the conference tournament to Texas.  BYU's deviations from the standards ranged from big to small.

Only three teams met "yes" standards for a #1 seed: Florida State, BYU, and UCLA.  It appears that the strong aspects of BYU's profile outweighed the negative aspects in the Committee's mind.  Nevertheless, the Committee made a significant departure from its past decision patterns by giving a #1 seed to a team from the #7 conference that won neither the conference regular season nor conference tournament competition.

Note:  The RPI ranked BYU #2, the KPI #3.  The KPI may have been a contributing factor for the Committee decision.  The Balanced RPI ranked BYU #5, Massey #5.

Penn State Getting a #2 Seed

Penn State met 3 "yes" standards for a #2 seed and 8 "no" standards.  The Committee's deviations from the "no" standards ranged from big to small.

The "no" standards all related in whole or in part to Penn State's Top 50 Results, which measures the value of its good results (wins and ties) against Top 50 opponents, assigns values to those results on a sliding scale based on the opponents' ranks, and overall is designed to show at how high a level the team has shown it can compete.  Penn State's best results were a tie with #13 North Carolina and a win over #17 Princeton.

With Penn State meeting both "yes" and "no" standards, it had a profile the Committee had not seen in the past.  Its getting a #2 seed means that in the Committee's mind, its "yes" attributes outweighed its "no" attributes.  Historically, which teams will be in the group that gets #1 through #4 seeds is quite predictable, as is which teams will get #1 seeds.  Where teams in the #2 through #4 group will end up in the #2 through #4 distribution is less predictable.  Thus Penn State getting a #2 seed involved a significant deviation from some of the Committee's past patterns, but is not a big surprise due to the unpredictable nature of seeding in the #2 through #4 range..

Note:  The RPI ranked Penn State #4, the KPI #4.  The KPI thus may have been a contributing factor for the Committee's decision.  The Balanced RPI ranked Penn State #4, Massey #9.

North Carolina Not Getting a #2 Seed

North Carolina met 2 "yes" standards for a #2 seed and 1 "no" standard.  The Committee's deviations from the "yes" standards were small to moderate.  The "yes" standards related to North Carolina's Non-Conference RPI and its Top 50 Results.    Its best results were a tie with #4 Penn State, a tie with #1 Florida State, and a tie with #12 Notre Dame.

With North Carolina meeting both "yes" and "no" standards and given the relative unpredictably of how the #2 through #4 seeds will be distributed, its not getting a #2 seed is not a big surprise.

Note:  The RPI ranked North Carolina #13, the KPI #14.  The KPI thus may have been a contributing factor for the Committee's decision.  The Balanced RPI ranked North Carolina #8, Massey #6.

Memphis Not Getting a #4 Seed

Memphis met 2 "yes" standards for a #4 seed and 12 "no" standards, thus presenting a profile the Committee had not seen before.  Its "yes" standards related to its Top 60 Head to Head Results combined with its lack of Poor Results.  The Committee deviations from the "yes" standards were big.  The Committee apparently concluded the negative aspects of its profile outweighed its positive aspects in relation to a #4 seed.  I do not consider this surprising.

Note: The RPI ranked Memphis #14, the KPI #11.  The KPI thus was not a factor for the Committee's decision.  The Balanced RPI ranked Memphis #15, Massey #8.

Seed Summary

Given the context of the no overtime rule being in only its second year and the possibility that most of the candidate group for #1 seeds may have been weak by historic standards, the Committee's seeds this year do not appear to involve surprising departures from its historic patterns.

Overall Summary

The Committee's not giving an at large position to the #27 RPI ranked team was a significant departure from the Committee's historic patterns and suggests significant Committee discomfort with the RPI.  Other than that, the Committee's decisions were about as expected, taking into consideration the NCAA's 2022 adoption of the no overtime rule and a possibly weaker than usual group competing for #1 seeds.

Thursday, November 9, 2023

REPORT 24: IN THE NCAA TOURNAMENT AT LARGE SELECTIONS, WHO BENEFITED FROM AND WHO GOT HURT BY THE NCAA RPI'S DEFECTS?

Now that we know the Women's Soccer Committee's at large selections, who benefited from and who got hurt by the current NCAA RPI's defects.  The following table is similar to the tables I provided in earlier posts, except that it compares the Committee's actual selections to what the likely selections would have been if the Committee had used the Balanced RPI.  As discussed in the preceding reports, the Balanced RPI does not have the current NCAA RPI's defects.

The following table shows who benefited and who got hurt.  I will explain below the table.  First is the Key for the table, then the table.


Candidates To Be Considered for At Large Positions

In the table, the first critical groups are the teams highlighted in green and red.  Historically, all the Committee's at large selections have come from teams ranked #57 or better.  The green highlighting is for eight teams that are in the Top 57 under the Balanced RPI but not under the current NCAA RPI.  Thus these are teams that are hurt by the current NCAA RPI's defects by, effectively, being excluded from the candidate group for at large selections.  The red highlighting is for eight teams that are not in the Top 57 candidate group under the Balanced RPI but are in the group under the current NCAA RPI.    Thus these are teams that benefit from the current NCAA RPI's defects by being included in the candidate group for at large selections.

There is a clear difference in the natures of the two groups.  The group that gets hurt by the current NCAA RPI is all Power 5 teams with one exception.  The group that correspondingly benefits is all non-Power 5 teams with one exception.  This is exactly as expected, since the current NCAA RPI discriminates against stronger conferences and in favor of weaker ones.

Regarding the two groups of teams, the three right-hand columns show important information.  Third from the right, the column shows the average current NCAA RPI rank of the team's opponents.  Second from the right, the column shows the average current NCAA RPI Strength of Schedule contribution rank of the team's opponents.  On the far right, the column shows the difference between these numbers.  Using Virginia as an example, the average current NCAA RPI rank of its opponents is 130.  The average current NCAA RPI strength of schedule contribution rank of its opponents, however, is only 175.  Thus according to the RPI itself, the formula's strength of schedule calculation understates Virginia's opponents' strength by 45 positions.  Contrast this to the red group's Lamar.  Lamar's current NCAA RPI opponents' average rank is 225, those same opponents' average rank as strength of schedule contributors is 199, so that according to the RPI itself, the formula overstates Lamar's opponents' strength by 26 positions.  If you look at the teams as red and green groups, it is clear:  The current NCAA RPI's strength of schedule problem is causing teams (red) that should not be in the at large candidate group to be in the group and preventing teams (green) that should be in the group from being there.

Selections for At Large Positions

The second critical groups are the teams highlighted C and D in the Category column.  The C teams are ones that did not get at large positions this year, but that likely would have gotten at large positions if the Committee had used the Balanced RPI: Virginia, Wake Forest, Northwestern, TCU, Washington, and UCF.  These are the teams that got hurt the most by the current NCAA RPI's defects.  Of these, TCU and UCF are in the current NCAA RPI's Top 57, but the other four are not.  The D teams are ones that did get at large positions, but that likely would not have if the Committee had used the Balanced RPI: Arizona State, Providence, Tennessee, Texas A&M, James Madison, and LSU.

For these second groups, you can see that this is not necessarily a matter of Power 5 versus non-Power 5 conferences.  Rather, it is a matter of the current NCAA RPI's defects having kept deserving teams from even getting realistic consideration for at large positions both by underrating them and by overrating other teams so that they occupy the limited candidate group positions.

Bottom Line

The bottom line this year is that:

Arizona State, Providence, Tennessee, Texas A&M, James Madison, and LSU benefitted from the current NCAA RPI's defects; and

Virginia, Wake Forest, Northwestern, TCU, Washington, and UCF got hurt by the defects.

Monday, November 6, 2023

REPORT 23: NCAA TOURNAMENT BRACKET PROJECTIONS

My system comes up with the following NCAA Tournament bracket projections, based on all of the season's results.  I will explain how the system works as I go along:

#1 Seeds


This table is for the Top 7 teams in the RPI rankings because historically all #1 seeds have come from the Top 7 in the rankings.  My system evaluates teams using 118 factors, each of which relates to the factors the NCAA requires the Committee to use in evaluating teams for at large selections (most of the 118 are combinations of two individual factors).  Most of the 118 factors have a "yes" value and a "no" value.  If a team's profile meets a yes value, it means teams that meet that value always have received a positive decision from the Committee, in this case a #1 seed.  If a team's profile meets a no value, it means teams that meet that value never have received a positive decision, thus in this case no #1 seed.  If a team meets both yes and no values, it means the team has a profile the Committee has not seen before.

As you can see in the table, Florida State and UCLA meet at least 1 yes value and 0 no values.  Thus the system identifies them as #1 seeds.  (The team ranked #1 by the RPI always has gotten a #1 seed.)  BYU has a profile the Committee has not seen before.

The table leaves BYU and the teams other than Florida State and UCLA to choose from for the remaining two #1 seeds.  Texas Tech and Penn State have too many no values.  This leaves BYU, Stanford, and Clemson as the candidates for the two remaining #1 slots.


Based on past history, after identifying clear #1 seeds, the factor that is most consistent with the Committee's picks for the remaining #1 seeds is their Head to Head v Top 60 Rank.  This is based on a scoring system I developed that measures results against Top 60 opponents -- without regard for the ranks of those opponents.  Using this as the tiebreaker, my system assigns the remaining #1 seeds to BYU and Stanford.

#2 Seeds


Using the same approach as for #1 seeds, the candidate group for #2 seeds is teams ranked #14 or better.  Here, Arkansas is a clear #2 seed.  After that, Penn State, North Carolina, Memphis, and Clemson all have profiles the Committee has not seen before.  In addition, Texas Tech and Georgetown are potential #2 seeds.


The tiebreaker factor for #2 seeds combines a team's RPI rank with its Top 50 Results rank, each weighted at 50%.  The Top 50 Results rank is based on a scoring system I developed, which is heavily weighted towards good results (wins or ties) against very highly ranked teams.  It essentially asks, at how high of a level have you shown you are able to compete.  It does not take losses into consideration.

As you can see, the tiebreaker assigns the remaining #2 seeds to Texas Tech, North Carolina, and Clemson.

#3 Seeds


The candidate group for #3 seeds is teams ranked #23 or better.  Brown is a clear #3 seed.  Penn State and Memphis are candidates with profiles the Committee has not seen before.  Georgetown, Notre Dame, Georgia, and Pittsburgh also are in the running.


The tiebreaker for #3 seeds is a combination of a team's RPI rating and its Top 60 Head to Head score rank.  The tiebreaker assigns the remaining #3 seeds to Penn State, Memphis, and Georgetown.

#4 Seeds


The candidate group for #4 seeds is teams ranked #26 or better.  Harvard and Georgia are clear #4 seeds.  Notre Dame, Pittsburgh, and Wisconsin also are in the running.
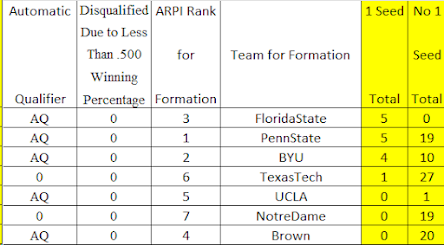

Here, the tiebreaker is a combination of a team's Top 50 Results rank and its conference's RPI.  The tiebreaker assigns the remaining #4 seeds to Wisconsin and Notre Dame.

#5 through #8 Seeds


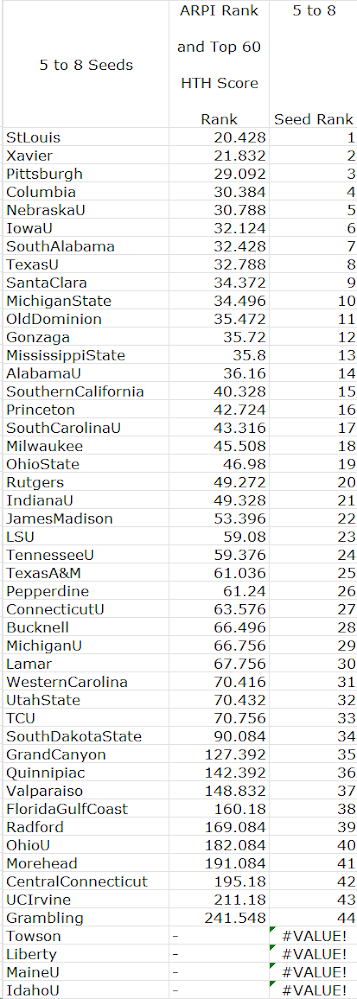
We did not have #5 through #8 seeds until last year.  Because of that, we do not have an historic Committee pattern for those seeds.  That being the case, I simply have used the combination of a team's RPI rank and its Top 50 Results rank as the basis for those seeds.  This yields St. Louis, Xavier, Pittsburgh, and Columbia as #5 seeds; Nebraska, Iowa, South Alabama, and Texas as #6 seeds; Santa Clara, Michigan State, Old Dominion, and Gonzaga as #7 seeds; and Mississippi State, Alabama, Southern California, and Princeton as #8 seeds.

At Large


The candidate group for at large positions is teams ranked #57 or better.  With the seeds and unseeded Automatic Qualifiers already set, there are 12 remaining at large positions.  The above table says that South Carolina, TCU, Ohio State, and Indiana are clear at large teams, which leaves 8 positions to fill.  Tennessee, Michigan, and LSU are possibilities with profiles the Committee has not seen before.  Rutgers, James Madison, Pepperdine, UCF, Arizona State, Connecticut, and Texas A&M also are possibilities.  


The at large tiebreaker is the combination of RPI rank and Top 60 Head to Head results rank.  This is a change from prior years when RPI rank and Top 50 Results score rank was the best predictor of at large selections.  Although I prefer the latter as a tiebreaker, the current statistical best predictor is the former, so that is what the above table shows.  Based on this, Rutgers, James Madison, LSU, Tennessee, Texas A&M, Pepperdine, Connecticut, and Arizona State are the system's last 8 at large selections.

Overall

Based on the above, the following table shows the system's seeds, the unseeded Automatic Qualifiers (5 in the NCAA Seed or Selection column), the unseeded at large selections (6 in the NCAA Seed or Selection column), and teams from the Top 57 at large candidate group not getting at large selections (7 in the NCAA Seed or Selection column).


Wednesday, November 1, 2023

REPORT 22: THE IVY LEAGUE AND THE RPI

 "There were teams and leagues that were able to trick the RPI, either intentionally or unintentionally."

Mark Few, Gonzaga men's basketball coach, in the Spokane Spokesman-Review, August 22, 2018

In 2018, the NCAA stopped using the RPI for men's basketball, replacing it with a different system.  This happened because Mark Few and other NCAA basketball coaches fought for the change.  Will DI women's soccer coaches follow their lead and fight for a change?  Of course, their situation is different as this is "just" women's soccer we are talking about, a change would be energy and time-consuming for NCAA staff, and they have many other jobs to do that they probably think are more important.  But one thing is certain:  There will not be change unless the coaches demand it.

This year, the RPI status of the Ivy League provides an excellent case in point for Mark Few's statement.  For games through October 29, the Ivies are the #2 ranked conference according to the RPI and that is almost sure to be where they end up.  According to my Balanced RPI, however, they are the #5 conference.  And, according to Massey, they are #7.  So, what gives?

Below are three tables, each with the same data but arranged differently.  The tables cover the Ivies' non-conference games.  In the tables, the blue highlights games the Ivy teams won.  The green highlights ties.  The peach highlights losses.

The first table is arranged by Ivy team, with the teams in their RPI rank order:


Using Brown as an example, the blue games are ones it won.  In the next-to-right-hand columns you can see Brown's rank as of October 29, which was #5.  In the right-hand column you can see the ranks of the opponents it beat.  As you can see, its best non-conference win was against the #152 ranked team.  The green games are ones it tied, both home games, against the teams ranked #13 and #62.  The peach game is a loss, an away game against the team ranked #35.

If you go through each team, you can make your own judgment whether its non-conference results seem consistent with its RPI rank.

The second table has the games arranged not by team but instead by wins, then ties, then losses, with each group's games in order of the opponent RPI ranks:


In looking at this table, bear in mind that the top four Ivy teams' ranks are #5 (Brown), #12 (Princeton), #16 (Harvard), and #24 (Columbia).

If you look at the wins rows at the top of the table, you will see that the Ivies have only one win against a team in the Top 30, a Princeton win at home against #14.  The Ivies' next best win is against #35 and they have a total of only 5 wins against teams in the Top 50.

If you look at the ties, the Ivies have only one tie against a team in the Top 30, a Brown tie at home against #13.  The Ivies' next best tie is against #34 and they have a total of only 3 ties against teams in the Top 50.  Brown has a tie at home against #62, Princeton has a tie away against #191, and Columbia has a tie away against #101.

If you look at the losses, Brown has an away loss to #35, Princeton has a home loss to #60, Harvard has away losses to #67 and #99, and Columbia has an away loss to #28.

In looking at the Ivies' poor ties and losses, it is important to remember that highly ranked teams do have occasional poor results.  The question here, however, is whether the totality of good results and poor results is consistent with having teams ranked #5, #12, #16, and #24.

The final table has the games arranged by opponents' geographic regions, then wins, losses, and ties within the regions, and then by opponent RPI ranks.


The first thing the table shows is that the Ivies played very few games outside their geographic region.  Thus their non-conference records mainly show where they fit within the North region.

The other thing the table shows may be revealing, although it is based on limited data.  The West is the strongest region based on average RPIs.  Against teams from the West, the Ivies' two wins are against teams ranked #186 and #230.  Harvard has an away tie against #39, Brown has a home tie against #62, and Columbia has an away tie against #101.  Columbia has an away loss to #28 and Harvard an away loss to #99.  These result suggest that there is something amiss in how the RPI ranks the Ivies in relation to teams from the West.

The above close looks at the Ivies' good and poor results strongly suggest that they are significantly overrated: Neither their good results nor their poor results support their ranks.  This raises the question of why this is happening.  The answer is in Mark Few's statement at the top of this report: Leagues are able to trick the RPI, whether intentionally or unintentionally.

In this case, every one of the Ivies had a good to excellent non-conference record, achieved mostly against opponents from the relatively weak North region.  They brought these records into conference play and because the RPI Strength of Schedule formula is based primarily on an opponent's winning record, each team bolstered every other team's RPI Strength of Schedule.  They were able to do this even though the opponents against whom they achieved their non-conference winning records by and large were unimpressive.  Simply put, the Ivies have tricked the RPI, whether intentionally or unintentionally.

Will the DI women's soccer coaches continue to put up with this situation?  Time will tell.

Tuesday, October 31, 2023

REPORT 21: EVALUATION OF THE KPI RATING SYSTEM

This year, the NCAA is allowing the Women's Soccer Committee to use an additional rating system when it evaluates teams, in addition to the RPI.  This is a good thing.

The additional rating system the NCAA is allowing the Committee to use is the KP Index, or KPI.  In 2022, the NCAA allowed the Division I Women's Field Hockey Committee to use the KPI to supplement the RPI.  I do not know who selected the KPI as the particular additional system for field hockey.  I believe the NCAA staff selected it for women's soccer since it already was in use for field hockey.

A big question is whether the KPI is a good supplemental system for DI women's soccer.  In my opinion, as I will show below, it is not.

In terms of how KPI ratings match generally with game results, the KPI is fine as a system:


In this table, the ARPI 2015 is the current NCAA RPI.  Massey is the Kenneth Massey system, which he has run for many years.  The URPI 50 50 SoS Iteration 15 is the Balanced RPI.  KPI ratings are available only for years since 2017, and I was able to use Massey ratings only through 2019.  For the current NCAA RPI and the Balanced RPI, I was able to use data from 2010 through 2022.  I excluded Covid-affected 2020.

The table shows the consistency of ratings with game results.  I determined, for each system, the percentage of games in which the team with the higher rating, after adjustment for home field advantage, won the game.  I did this using only games that ended in wins or losses since the percentage of tie games differs from year to year and I did not want those differences to deceptively skew the results.

In the percentages, in the Overall column a difference of 0.1% represents a difference of about 3 games per year, out of about 3,000, in which game results match ratings.  In the Top 60 column, a difference of 0.1% represents a difference of about 1 game per year, out of about 1,000.

As you can see, the differences in consistency of ratings with game results are not large.

Knowing that for DI women's soccer, game results will be inconsistent with ratings in a significant number of games as the above table shows, one would hope that the inconsistencies would be due either to (1) actual changes in teams' performance over the course of the season or (2) true upsets, which should be randomly distributed.  And, conversely, one would hope that the inconsistencies are not due to rating system discrimination against or in favor of teams based on characteristics not related to performance.  In particular, one would hope that the inconsistencies are not due to discrimination among teams based on the conferences they are in or the geographic regions in which they are located.

The following table shows whether the four rating systems discriminate among teams based on the conferences they are in:


This table is based on a system that evaluates how well the ratings of teams in a particular group, such as a conference, match with their results against teams from other similar groups, such as other conferences.  For a detailed description of the system, see RPI: Measuring the Correlation Between Teams' Ratings and Their Performance.

This particular table deals with the ratings compared to the results of each conference's teams, as a group, in games against teams from other conferences.  If the results of a conference are consistent with with what the ratings say they should be, then the performance percentage of the conference is 100%.  If the results are better than the ratings say they should be, then the performance percentage is above 100%.  If the results are poorer, then the performance percentage is below 100%.

The table looks at conference performance three ways:

In the first four columns with percentages, it looks at the most closely rated 10% of all games.  These are the games in which differences between ratings and results are most likely to show up.

In the next four columns, it looks at the most closely rated 20% of all games.  I have included these columns to take into account that for the KPI, the 2017 through 2022 data set is relatively small and I was concerned that lack of data might unfairly skew the 10% results.

The final four columns are based on having broken down all of the games into the most closely rated 10%, the second most closely rated 10%, and so on in 10% segments so as to cover all games.  The system then calculates the performance percentage for each segment.  The final four columns are based on the average performance percentage across all 10 segments.  This gives a picture of the net effect of any difficulty the rating system has rating teams from a conference in relation to teams from other conferences.

Using the 10% group as an example, the first column for that group shows the performance percentage of the conference that performs the best in relation to its ratings -- 124.9% for the current NCAA RPI.  The next column shows the percentage for the poorest performing conference -- 66.8%.  The next column shows the difference -- the Spread -- between those two percentages -- 58.0%.  The next column is based on the differences from 100% of all of the conferences, added together -- the Over and Under Total -- 305.9%.  The Spread and the Over and Under Total are measurements of how well the system is able to rate teams from the different conferences in relation to each other.  The lower the percentages, the better.

As the table shows, the KPI has the same problem as the current NCAA RPI when trying to rate teams from the different conferences in relation to each other.  One must be careful not to pay too much attention to the exact KPI numbers due to its limited data set, but the table is clear that it has a conference rating problem.  The Balanced RPI, on the other hand, performs much better than either the KPI or the current NCAA RPI.

There is another aspect, of rating teams from the different conferences in relation to each other, that the above tables do not show.  This is shown in charts that show how the conference performance percentages relate to conference strength.  Here is a chart for the current NCAA RPI.


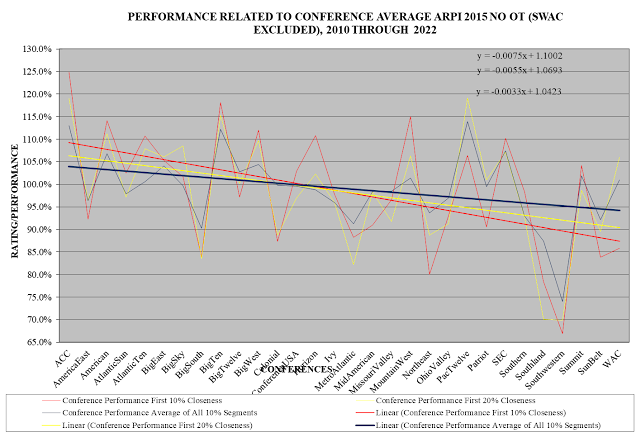
In this chart, the conferences are arranged from left to right in order of the average RPIs of their teams, with the best average RPI on the left and the poorest on the right.  (I have not included the Southwestern Athletic Conference because its performance percentage is so poor I believe it would make the trends overly steep.)  The red is for performance in the most closely rated 10% of games, the yellow for 20%, and the dark blue for the average across all 10% segments.  The straight lines are computer generated trend lines showing the relationship between conference strength and how conferences perform in relation to their ratings.  The three formulas in the upper right of the chart are formulas for the three trend lines.  The chart shows that under the current NCAA RPI, on average, teams from stronger conferences, in non-conference games, perform better than their ratings say they should and teams from weaker conferences perform more poorly than their ratings say they should.  In other words, on average, the current NCAA RPI discriminates against teams from stronger conferences and in favor of teams from weaker conferences.

Here is the same chart, but for the KPI:


You can see that, on average, the KPI discriminates against teams from stronger conferences and in favor of teams from weaker conferences.

Here is the same chart, but for the Balanced RPI:


As you can see, the Balanced RPI has minimal discrimination in relation to conference strength.

The following table summarizes these three charts:


Using the current NCAA RPI and the closest 10% group of games as an example, the first 10% column shows the highest point of the 10% group trend line on the left of the current NCAA RPI chart -- 111.6%, as determined based on the 10% group trend formula.  The second 10% column shows the lowest point of the trend line on the right -- 88.1%.  The 10% Spread column shows the difference between the performance at the high end and the low end of the trend line -- 23.5%.  This difference is a measure of the amount of discrimination against stronger and in favor of weaker conferences.  As you can see, looking at the 10%, 20%, and All columns, both the current NCAA RPI and the KPI have significant discrimination; and the Balanced RPI has minimal discrimination and, when looking at all the 10% groups combined, virtually no discrimination.

Here are tables and charts like the ones for conferences, but instead for the geographic regions within which teams are located:


As you can see, both the current NCAA RPI and the KPI have significant discrimination based on geographic regions; and the Balanced RPI has minimal discrimination and, when looking at all the 10% groups combined, virtually no discrimination.

The bottom line is that the KPI is not a good supplemental rating system for DI women's soccer.  Rather, it has the same defects as the current NCAA RPI:  It discriminates against stronger conferences and geographic regions and in favor of weaker ones.

The NCAA definitely needs to allow the Women's Soccer Committee to use a rating resource in addition to the current NCAA RPI (although discontinuing use of the current NCAA RPI in favor of another system would be better).  Using the KPI as the additional resource, however, is not helpful as it only reinforces the current NCAA RPI's discrimination defects.  Thus although using another rating system is good, using the KPI as that system is not.

Monday, October 30, 2023

REPORT 20: UPDATE INCORPORATING RESULTS THROUGH SUNDAY, OCTOBER 29

This is my  week eleven report for the 2023 season.

In the first table below, I show teams’ current RPI rankings, including showing teams in the history-based candidate groups as of this point in the season for NCAA Tournament #1 through #4 seeds and at large selections.  (I do not show candidate groups for #6 through #8 seeds, as there is only one year of data for those groups, which I do not believe is enough precedent to establish reliable groups.)  In addition, if you check the Team column, you will see some highlighted teams.  These are teams outside the current RPI Top 57, but inside the Balanced RPI Top 57.  Except for Washington State and Portland, which are in the current RPI candidate group for this week, they are teams that likely will not get at large selection consideration from the Committee due to its use of the current RPI even though, according to the Balanced RPI, they should get consideration.

In the other  three tables, I show, using the actual results of games played through October 22 and simulated results for games not yet played (including simulated conference tournaments):

1.  Teams’ simulated end-of-season ranks using the current NCAA RPI and my Balanced RPI;

2.  Based on the current NCAA RPI, teams in candidate pools for NCAA Tournament #1, 2, 3, and 4 seeds and for at large selections and where they fit within the pools; and

3.  Likely differences in at large selections for the NCAA Tournament if the Women’s Soccer Committee were to use the Balanced RPI rather than the current NCAA RPI.

The background for the information in the three tables is in 2023 Reports 1 through 4.  NOTE: In determining the simulated results of games not yet played, I use teams' current NCAA RPI ratings based on games played through October 29.

Summarizing the likely differences in at large selections for the NCAA Tournament in changing from the current NCAA RPI to the Balanced RPI, derived from the last table below:

At Large Candidate Teams:  Eleven teams that are not at large candidates under the current NCAA RPI are candidates under the Balanced RPI.  Of these, 1 is from the Middle, 0 from the North, 4 from the South, and 6 from the West regions.  Nine are from Power 5 conferences and 2 are not.  One of them, from the West and not from a Power 5 conference, is an Automatic Qualifier.

No Longer Candidate Teams:  Eleven teams that are at large candidates (or Automatic Qualifiers) under the current NCAA RPI are not candidates under the Balanced RPI.  Of these, 2 are from the Middle, 1 from the North, 7 from the South, and 1 from the West regions.  None is from a Power 5 conference, 11 are not.  Of the 11, 5 are Automatic Qualifiers.

Selected Teams: Five teams that either definitely (5 teams) or likely (0 teams) are not at large selections under the current NCAA RPI likely are at large selections under the Balanced RPI.  Of these, 1 is from the Middle, 0 from the North, 1 from the South, and 3 from the West regions.  Four are from Power 5 conferences and 1 is not.

No Longer Selected Teams: Five teams that likely are at large selections under the current NCAA RPI likely are not at large selections under the Balanced RPI.  Of these, 1 is from the Middle, 2 from the North, 2 from the South, and 0 from the West regions.  Two are from Power 5 conferences and 3 are not.

Current RPI Rankings

The first table below shows teams’ current RPI ranks, their strength of schedule contributor ranks, their opponents’ average RPI ranks, and their opponents’ average strength of schedule contributor ranks.  These will help you see the differences between team RPI ranks and strength of schedule contributor ranks -- in an ideal rating system, those ranks should be the same, but under the current NCAA RPI they are not and often are not by a wide margin.

In addition, the table shows the same rank items for my Balanced RPI.

And, on the left, the table shows teams that are potential #1 through #4 seeds and at large selections, at this stage of the season, based on Committee decisions since 2007.  The poorest ranked team in any candidate group is the poorest ranked team as of the current week that the Committee gave a positive decision to in its end of season decision process.

The second table shows average ranks for conferences, again allowing comparisons of average RPI ranks and average strength of schedule contributor ranks.  The third table is similar, but is for geographic regions.


Simulated End-of-Season Ranks

(ARPI 2015 BPs is the current NCAA RPI; URPI 50 50 SoS Iteration 15 is the Balanced RPI)


Simulated NCAA Tournament Seed and At Large Selection Candidate Pools (based on current NCAA RPI)

NOTE; Unless otherwise noted, in each table I will show the number of teams that as of the end of the season will be in the historic candidate group for the particular decision.

At Large (showing Top 57 teams)


#1 Seeds (showing Top 7 teams), most of which have significant negatives in their profiles, by historic standards:


#2 Seeds (showing Top 14 teams):


#3 Seeds (showing Top 23 teams):


#4 Seeds (showing Top 26 teams):


Simulated NCAA Tournament At Large Selections Using Current NCAA RPI As Compared To Balanced RPI


Monday, October 23, 2023

REPORT 19: UPDATE INCORPORATING RESULTS THROUGH SUNDAY, OCTOBER 22

This is my tenth weekly report for the 2023 season.

In the first table below, I show teams’ current RPI ratings, including showing teams in the history-based candidate groups as of this point in the season for NCAA Tournament #1 through #4 seeds and at large selections.  (I do not show candidate groups for #6 through #8 seeds, as there is only one year of data for those groups, which I do not believe is enough precedent to establish reliable groups.)

In the other  three tables, I show, using the actual results of games played through October 22 and simulated results for games not yet played (including simulated conference tournaments):

1.  Teams’ simulated end-of-season ranks using the current NCAA RPI and my Balanced RPI;

2.  Based on the current NCAA RPI, teams in candidate pools for NCAA Tournament #1, 2, 3, and 4 seeds and for at large selections and where they fit within the pools; and

3.  Likely differences in at large selections for the NCAA Tournament if the Women’s Soccer Committee were to use the Balanced RPI rather than the current NCAA RPI.

The background for the information in the three tables is in 2023 Reports 1 through 4.  NOTE: In determining the simulated results of games not yet played, I use teams' current NCAA RPI ratings.

Summarizing the likely differences in at large selections for the NCAA Tournament in changing from the current NCAA RPI to the Balanced RPI, derived from the last table below:

At Large Candidate Teams:  Eleven teams that are not at large candidates under the current NCAA RPI are candidates under the Balanced RPI.  Of these, 2 are from the Middle, 0 from the North, 4 from the South, and 5 from the West regions.  Nine are from Power 5 conferences and 2 are not.  One, from the West and not from a Power 5 conference, is an Automatic Qualifier.

No Longer Candidate Teams:  Eleven teams that are at large candidates (or Automatic Qualifiers) under the current NCAA RPI are not candidates under the Balanced RPI.  Of these, 2 are from the Middle, 2 from the North, 5 from the South, and 2 from the West regions.  One is from a Power 5 conference, 10 are not.  Of the 11, 7 are Automatic Qualifiers.

Selected Teams: Five teams that either definitely (5 teams) or likely (0 teams) are not at large selections under the current NCAA RPI likely are at large selections under the Balanced RPI.  Of these, 1 is from the Middle, 0 from the North, 2 from the South, and 2 from the West regions.  Five are from Power 5 conferences and 0 are not.

No Longer Selected Teams: Five teams that likely are at large selections under the current NCAA RPI likely are not at large selections under the Balanced RPI.  Of these, 1 is from the Middle, 3 from the North, 1 from the South, and 0 from the West regions.  One is from a Power 5 conference and 4 are not.

Current RPI Rankings

The first table below shows teams’ current RPI ranks, their strength of schedule contributor ranks, their opponents’ average RPI ranks, and their opponents’ average strength of schedule contributor ranks.  These will help you see the differences between team RPI ranks and strength of schedule contributor ranks -- in an ideal rating system, those ranks should be the same, but under the current NCAA RPI they are not and often are not by a wide margin.

In addition, the table shows the same rank items for my Balanced RPI.

And, on the left, the table shows teams that are potential #1 through #4 seeds and at large selections, at this stage of the season, based on Committee decisions since 2007.  The poorest ranked team in any candidate group is the poorest ranked team as of the current week that the Committee gave a positive decision to in its end of season decision process.

The second table shows average ranks for conferences, again allowing comparisons of average RPI ranks and average strength of schedule contributor ranks.  The third table is similar, but is for geographic regions.


Simulated End-of-Season Ranks

(ARPI 2015 BPs is the current NCAA RPI; URPI 50 50 SoS Iteration 15 is the Balanced RPI)


 Simulated NCAA Tournament Seed and At Large Selection Candidate Pools (based on current NCAA RPI)

NOTE; Unless otherwise noted, in each table I will show the number of teams that as of the end of the season will be in the historic candidate group for the particular decision.

At Large (showing Top 57 teams)


#1 Seeds (showing Top 7 teams):


#2 Seeds (showing Top 14 teams):,


#3 Seeds (showing Top 23 teams):


#4 Seeds (showing Top 26 teams):


Simulated NCAA Tournament At Large Selections Using Current NCAA RPI As Compared To Balanced RPI